Section 05 – Conformation Recording
Introduction
This document contains a description of conformation traits scored in dairy cattle breeds, dual purpose cattle, beef cattle breeds and dairy goats. For the four groups a separate trait list has been established. For the traits, trait definitions are given in wording and with drawings.
Besides giving trait definitions, recommendations are given on improvement and transparency of data collection and monitoring classifiers.
For the dairy, dual purpose and beef cattle breeds a recommendation on scoring conformation defects is given.
Linear and composite type traits
Linear Type Traits
Linear type traits are the basis of all modern type classification systems, and are the foundation of all systems for describing the animal. Linear classification is based on measurements of individual type traits instead of opinions. It describes the degree of trait not the desirability.
Advantages of linear scoring are:
- Traits are scored individually.
- Scores cover a biological range.
- Variation within traits is identifiable.
- Degree rather than desirability is recorded.
Standard traits
The standard traits satisfy the following conditions:
- Linear in a biological sense.
- Single Trait.
- Heritable.
- Economic value, direct or indirect with reference to the breeding goal.
- Possible to measure instead of score.
- Variation within the population.
- Each linear trait should describe a unique part of the animal which is not covered by a combination of the other linear traits.
Composite traits and general characteristics
Composite traits
- Composite traits are groups of linear traits relating to one specific area.
- The individual linear traits are weighted according to economic breeding objectives.
- The main composite traits for dairy cattle are: frame including rump, dairy strength, mammary, feet/legs.
- The main composite traits for dual purpose breeds are: frame, mammary, feet/legs and muscularity.
- The main composite traits for beef breeds are: muscularity, type (breed standard), feet/legs, development and final score.
- The main composite traits for dairy goats are: frame, udder, feet/legs and final score.
General characteristics
Type classification programs also include phenotype assessment. These are described as general characteristics or combined traits, which are not linear in a biological sense. A subjective score is given for the desirability of the animal according to the breeding goal.
- Female animals for dairy and dual purpose breeds are inspected, classified and assigned grades/scores ranging from 50-97 points.
- For beef breeds animals are inspected, classified and assigned grades/scores ranging from 60-99 points.
- Dairy goats are inspected, classified and assigned grades/scores ranging from 1-9 points.
The most common scale for mature cows (second or more lactations) in points are described in Table 1.
| Table 1. Range of scores for general characteristics or combined traits for cattle of dairy, dual purpose and beef breeds and for dairy goats. | |||
| Dairy and dual purpose breeds | Beef breeds | Dairy goats | |
| Excellent | 90 - 97 | 90 - 99 | 9 |
| Very Good | 85 - 89 | 85 - 89 | 7 - 8 |
| Good Plus | 80 - 84 | 80 - 84 | 4 - 6 |
| Good | 79 - 75 | 79 - 75 | 2 - 3 |
| Fair/Poor/Insufficient | 50 - 74 | 60 - 74 | 1 |
The awarding of classification grades varies in each country depending upon the breeding goals, and therefore classification scores must be considered in the context of the country of inspection.
The final class and score are derived from a breakdown of the main functional areas of the female:
- For dairy cattle: 1) Frame including Rump, 2) Dairy Strength, 3) Mammary System and 4) Legs/Feet.
- For dual purpose cattle: 1) Frame, 2) Mammary System, 3) Feet & Legs and 4) Muscularity.
- For beef breeds: 1) Muscularity, 2) Type (breed standard), 3) Legs/Feet and 4) Development.
- For dairy goats: 1) Frame, 2) Udder and 3) Legs/Feet.
For the quality of data for beef breeds it is important to score the traits for categories of similar age or sex. For example:
- Calves at weaning (5-10 months).
- Heifers: 6 months before calving.
- Cows: between first and second calving.
For the quality of data of dairy goats it is important to score the traits for categories of similar age or sex.
The weighting of the component breakdown scores should meet the breeding goals in the Country of inspection.
- It is recommended that for first lactating cows of dairy and dual purpose breeds the range of scores used is 70 - 90 points. The average score is always in the middle of the maximum and minimum a first lactating cow can be awarded.
- For beef breeds it is recommended that for animals the range of scores used is 60 - 99 points. In the case of the range 60 - 99, the population average should be close to 80.
For dairy goats it is recommended that for animals the range of scores used is 1 - 9 points. The average score is always in the middle of the maximum score and the minimum score the group (for example population within a country) can be awarded. In the case of the range 1 - 9, the population average should be close to 5.
Genetic evaluation of dairy and dual purpose animals
Type inspection system - Genetic evaluation
- Breeding values for bulls and cows to be based on the classification of cows in the first lactation scored in a herd evaluation system.
- In a herd evaluation system all first lactating cows, which have not be previously evaluated, must be scored during the visit of the classifier
- Additional classifications to obtain a bull proof may only be possible if completed by the same organisation and daughters are sampled randomly with sufficient number of herd mates (contemporaries) scored during the same visit. A minimum of 5 first lactating cows, which qualify for genetic evaluation, are inspected at the same visit
Evaluation model
- Modern BLUP evaluation techniques should be used to obtain accurate unbiased evaluations.
- Data should be corrected for influencing factors such as age, stage of lactation and season by the model. Classifiers should not make adjustments during scoring.
- Corrections for variation between classifiers are required to avoid heterogeneity of variance.
- Herd mates are defined as the contemporaries of the evaluated heifers in the same lactation, scored during the same visit by the same classifier.
Publication of information
- Publish bull-proofs around an average of 0 and a genetic standard deviation of 1.0.
- Proofs of widespread bulls should be published as bar graphs covering the range between +3 and -3 standard deviations.
- Or: Mean of 100 & the standard deviation in the base population where this standard deviation is adjusted to the situation the proofs of cows have a reliability of 100%.
- The base of sire and cow evaluation should follow the definition of the production proofs, given by Interbull. This includes a stepwise fixed base that should be renewed every five years. The base is defined by cows born 5 years previously.
Conformation recording of dairy cattle
The ICAR multi dairy breed conformation recording recommendation integrates with the World Holstein-Friesian Federation guidelines on the international harmonization of linear type assessment, trait definition, evaluation standards and publication of type proofs for bulls.
This document contains a list of approved standard traits, which is a list of traits which should be scored by all organisations in the same way to improve further harmonisation on international level, also on Interbull level. The data collected within these recommended standards qualifies for MACE evaluation by Interbull.
Further the document contains a list of 5 traits which are commonly used by organisations in the dairy and dual-purpose breeds world-wide. This list of common standard traits is added to improve harmonisation of these traits too.
Besides giving trait definitions on standard traits, recommendations are given on improvement and transparency of data collection and monitoring classifiers.
The list with standard traits and the standard trait definition for Dairy Cattle can be found in Appendix 1: The standard trait definition for Dairy Cattle.
Conformation recording of dual purpose cattle
This document contains a list of approved standard traits, which is a list of traits which should be scored by all organisations in the same way to improve further harmonisation on international level, also on Interbull level. The data collected within these recommended standards qualifies for MACE evaluation by Interbull.
Further the document contains a list of 5 traits which are commonly used by organisations in the dairy and dual-purpose breeds world-wide. This list of common standard traits is added to improve harmonisation of these traits too.
Besides giving trait definitions on standard traits, recommendations are given on improvement and transparency of data collection and monitoring classifiers.
The standard trait definition for Dual Purpose Cattle can be found in Appendix 2: The standard trait definition for Dual Purpose Cattle.
Conformation recording of beef cattle
The ICAR multi beef breed conformation recording recommendation describes a set of conformation traits which currently are used in several countries in several breed. The traits are defined in such a way that they are not breed specific.
This document contains a list of standard traits, which is a list of traits which could be scored by all organisations in the same way to improve further harmonisation on international level.
The list with standard traits and the standard trait definition for Beef Cattle can be found in Appendix 3: The standard trait definition for beef breeds
Conformation recording of dairy goats
The ICAR multi dairy goat breed conformation recording recommendation describes a set of conformation traits which currently are used in several countries in several breed. The traits are defined in such a way that they are not breed specific.
This document contains a list of standard traits, which is a list of traits which could be scored by all organisations in the same way to improve further harmonisation on international level.
The list with standard traits and the standard trait definition for dairy goats can be found in Appendix 4: The standard trait definition for dairy goats
Improving data quality and monitoring classifiers
Introduction
When collecting data on animal performances on a routine basis it is important to do this in a consistent and transparent way. In this way quality of data can be guaranteed and for everybody it is clear how it is done. This is also important for scoring animals for conformation traits, which is normally done by classifiers, specially trained doing this job.
This chapter describes the improvement of quality and transparency of data collection for conformation traits.
Practical aspects of type classification system
One organisation should be in charge of classifications within each evaluating system.
There should be a head-classifier in charge of training and supervising other classifiers within the evaluating system to achieve and maintain a uniform level of classification. Additionally the exchange of information between head-classifiers from different systems/countries is recommended.
Individual full time professionals should complete classification. Classifiers should be independent of commercial interest in AI-bulls/studs.
Classifiers must record the trait as observed without adjustment e.g. Age, stage of lactation, sire or management system.
The working information provided for the classifier should make no reference to the pedigree or performance of the animal.
Classifiers should always rotate classification areas (herds and regions) to ensure a good data connection between regions and to minimise the sequential scoring of animals by the same classifier. This way of working reduces this risk of classifier times regional genetics interaction or classifier times herd interaction.
An advisory group can be installed with expertise in the field of conformation classification, statistics, breeding, training people, in order to monitor and advise on the improvement to the classification system.
All factors accounting for any non-genetic variance should be recorded when a herd is visited, e.g. classifier's identification, date/time of scoring, management group, housing system, flooring, nutritional status. This makes it possible to find possible interactions between the environmental factors and the trait scored.
Types of housing can be free stall, tie stall, mixture (stall plus outside).
Types of floors can be concrete, cement with groves, slats, sand, rubber, straw, pasture.
Training and monitoring of classifiers
The monitoring and performance evaluation of classifiers is an important part of the standardisation of the ICAR international type program.
Objectives
Improve accuracy of data collection, within country all classifiers should:
- Apply the same trait definition
- Apply the same mean.
- Apply the same spread of scores.
Tools for objective 1:
- National group training sessions.
- Statistical monitoring of individual classifiers performance with reference to mean, spread and normal distribution of scores.
- Compute the correlation between the scores of one classifier and the group by using bivariate analysis. This shows the quality of harmonisation of trait definition between classifiers.
- Improve the genetic correlation for linear traits between countries (Interbull evaluation)
- Apply the same trait definition in all countries.
Tools for objective 2:
- International training of head classifiers.
- International group training sessions.
- Audit system.
If a country decides to change the definition of a trait, it is recommended not to use previous scores or use only as a correlated trait in the national genetic evaluation system.
National group training sessions
One way of improving harmonisation of scoring by classifiers is having regular training sessions with a group of classifiers.
There are many ways to accomplish trait harmonisation through training sessions. Normally a training session consists of scoring a group of animals and the scores of individual classifier are compared with the scores of the other classifiers and/or head classifier.
Attention points are:
- Use a group of animals for training session which is representative for the population classifiers have to score during their herd visits.
- Deviations of individual scores are discussed and it is made clear which is the correct score for a certain trait on an animal.
- Scores of each classifier are analysed per trait using some analysis tools:
- Compute the mean and standard deviation of the deviations of the scores on animals per trait, per classifier. The deviation is the difference between the score and the average group score for a trait, for an animal. This gives insight in the scoring of individual classifier: always above or below the mean, more variation in scoring a trait than the group/head classifier. (with a test it can be shown if the differences found are significant).
- Compute the spread of the deviation of scores given by classifier per trait. This gives insight in how consistent a classifier is scoring a trait. (with a test it can be shown if the differences found are significant).
- Instead of scoring a group of animals once, the animals can be scored twice by the classifiers, for example in the morning and in the afternoon. Based on these scores (approximately 20) the repeatability per classifier per trait can be computed.
Statistical monitoring of individual classifiers
The scores of a classifier from a certain period in time can be analysed. A period can be 12 or 6 months, for example.
From these scores the mean and standard deviation can be computed. The mean should be close to (maxscore-minscore)/2, and the standard deviation should be near (maxscore-minscore+1)/6, where minscore is the lowest score on the scale and maxscore is the highest score on the scale. For example: scoring a trait on a scale of 1-9, a mean is expected of 5 and a standard deviation of 1.5.
Another option is to compute the correlation between the scores of one classifier and the scores of rest of the group by using bivariate genetic analysis. This shows the quality of harmonisation of trait definition between classifiers (Veerkamp, R. F., C. L. M. Gerritsen, E. P. C. Koenen, A. Hamoen and G. de Jong. 2002. Evaluation of classifiers that score linear type traits and body condition score using common sires. JDS 85:976-983).
For this analysis, two data sets are created, one with scores of one classifier and the other with scores of all other classifiers from a certain period, for example 12 months. Both data sets can be analysed in a bivariate analysis, estimating different (genetic) parameters. The analysis can be carried out for each trait and for each classifier. From the bivariate analyses the following parameters can be derived:
- Heritability: the heritability estimated within each classifier can be used as criteria for the repeatability of scores within classifiers, albeit the optimum value is not unity but depends on the true heritability of each trait.
- Genetic correlation: the genetic correlation between two data sets can be used as a measure of the repeatability between classifiers, where a genetic correlation of one between classifiers is expected.
- Genetic standard deviation.
- Phenotypic standard deviation (= square root of genetic variance and error variance).
For the evaluation of each trait for each classifier the diagram in Figure 1 can be used.
Evaluation obviously starts with the mean score for each classifier, i.e., the mean should be close to the trait standard (5 for linear traits and 80 for descriptive traits). Secondly, the genetic standard deviation should not be lower than the average.
Figure 1. Scheme for evaluation trait by classifier using genetic parameters.
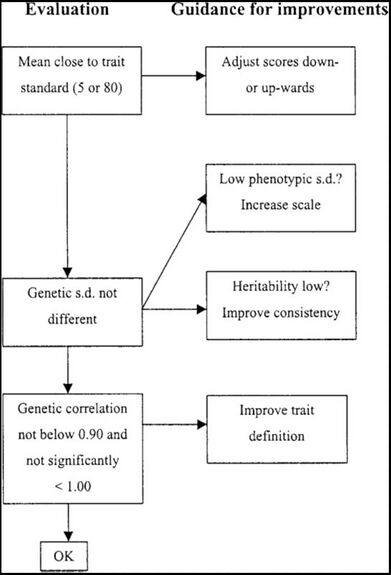
If the genetic standard deviation is lower, this could be due to the scale used (measured by the phenotypic standard deviation), due to poor within classifier repeatability (a low heritability) or both. If the low genetic standard deviation goes together with a low phenotypic spread, the advice is the classifier should use the scale in a better way, use more the extreme scores. If the genetic spread goes together with a low heritability, then the classifier should score the trait more consistently, apply the same definition.
If the genetic correlation is too low the classifier is likely to score a trait different than other classifiers.
All the parameters from the system can be tested using the standard error on the parameters estimated. Every classifier can be tested against the average of the parameters of all classifiers for a certain trait. A classifier with a few scores may deviate a bit more from the average of the group, therefore taking the standard error into account in a statistical test is more fair.
Auditing a classification system
The Classification system applied can be further improved by using an audit system where experts familiar with the conformation classification in other countries or organisations, examine the situation in your organisation or country.
An important issue is that information is exchanged between people responsible for the classification system.
Different options to audit are:
- By using international workshops, in which information can be informally exchanged regarding how classifiers are trained and conduct their daily work
- By inviting classifiers and/or a head classifier from another country or organisation to participate in or lead group training sessions
- By having a group of experts visit an organisation responsible for classification, conduct a survey on methods and procedures, report their findings and makes suggestions for improvements.
Recommendation on scoring conformation defects in cattle
Introduction
In many conformation systems for cattle defects are scored when scoring animals for linear traits and general characteristics. Most of the time defects are used to determine the score for general characteristics.
This chapter describes characteristics of defects for dairy, dual purpose and beef cattle and contains a list of proposed defects which could be used. They are considered to be important for one of the breed types (dairy, dual purpose and/or beef) and could be considered by countries or organizations, that do not score them up to now. If a country or organization has already a list of defects, they could consider to reduce the list according to the ICAR list.
Description of defect
Defects are not there to describe the whole variation in the population, but only a problematic trait (e.g. side leak) or a trait with a high enough frequency in the population.
The number of defects scored should be kept as low as possible as more defects means also more labor.
The easiest way to score conformation defects in a digital system is when a cow is scored for a group of the linear traits (frame, dairy strength, mammary system, legs/feet), the classifier is requested by the system if there are any defects within this particular group.
A conformation defect could be scored when it has the following characteristics:
- Heritable.
- Not rare.
- iI problematic for functionality.
- Is clearly described and visible.
- Should be scored as 0/1/2 (as soon as there is more variation and the frequency in population is considerable, one could/should consider to score this trait as a linear trait (scale 1-9).
- Is used to come up with a score for a general characteristic.
Defects have no value to be scored when it is not used in determining general characteristics or when it is not used in a genetic evaluation.
The advantages of scoring defects are:
- Get overview what the status of a specific defect is in the population.
- Could be used for determining the score for general characteristics.
- Could be used to present figures per bull.
Disadvantage of scoring defects:
- Difficult to harmonize classifiers as definitions are not always clear and for training sessions it is very hard to find a group of cows representing all defects.
Defects can be scored with 0 (not present), 1 (slightly present) or 2 (pronounced defect). More practical is that classifier score defects only when they are present, 1 (slightly present) or 2 (pronounced defect).
Approved standard
The list with approved conformation defects is chosen such that they satisfy the characteristics mentioned in 9.2.
Per defect a definition is given in Table 2 and it is indicated in which type of breed the defect can have added value.
|
Defect |
Definition |
Used in type of breed |
||
|
Dairy |
Dual purpose |
Beef |
||
|
Open shoulder |
A significant gap between the tip of the shoulder and the side of the body |
|
X |
|
|
Weak crops |
The part of the animal behind the shoulder (just below the chine) is a lot narrower than the shoulder |
X |
X |
|
|
High tail |
Evaluated by considering the tailhead in relation to the pins viewed from the rear. It could be considered as a defect when tailhead is at least 9 cm over the pins. |
X |
X |
X |
|
Advanced anus |
Anus is ahead of pin bone. Tendency for the anus and vagina to be pulled forward. |
X |
|
|
|
Toes out front |
Animal walks with a slight amount of toeing out. Maybe due to a twisting knee or to a lack of heart. |
X |
X |
|
|
Crampy |
Unnatural or irregular contraction of muscles of the rear legs. |
X |
|
|
|
Thurls too far back |
Ratio of distance of thurl position to rump bone and thurl position to pin bone ratio is larger than 4:1 (80%-20%) |
X |
|
|
|
Blind quarter |
Quarter never given milk. |
X |
|
|
|
Webbed teats |
An extra teat is attached to functional teat. |
X |
|
|
|
Side leak |
Little functional hole on the side of the teat. |
X |
X |
|
|
Extra functional teats |
Extra teats which produce milk. |
X |
|
|
Relationship between conformation and functional traits for dairy and dual purpose cattle
General considerations on the use of conformation data for longevity source
Conformation appraisal of cattle was introduced with the goal of comparing animals with breed standards (true type model). An additional goal of conformation recording was to be a simple predictor of production potential and longevity.
Since these times, many new traits have been recorded and evaluated for dairy and dual-purpose cattle regarding health and longevity. These traits have been supplemental to conformation recording and have even replaced them for certain purposes.
However, conformation recording is still an efficient way to assess many cows during a relatively short period of time and requires less commitment and time from the dairy producer to collect the data.
The usefulness of this data for the prediction of health and longevity should be considered in the setting up of a conformation recording system.
In Appendix 5, the relationship between some of the ICAR standard conformation linear traits for dairy and dual-purpose cattle and health and longevity is described in detail. This information can be used to show farmers how the conformation scores can help him to breed a kind of cow which is able to perform the best in the herd.
Guidelines on usage of data from AMS systems to derive udder conformation traits
Introduction
To collect information on quality of conformation of udders, the udders of dairy cows are scored by professional classifiers. In the ICAR guidelines several linear udder conformation traits are defined for Dairy Cattle (Appendix 1) and Dual Purpose Cattle (Appendix 2).
High genetic correlations have been reported in literature between linear scored traits and the same traits based on data from automatic milking systems (AMS) (Byskov et al., 2012; Poppe et al, 2019). The advantage of using data from AMS is that information is collected continuously during the whole lactation and also over lactations. In a regular classification system a cow is scored only once during her life, at one moment in the first lactation. Further the collection of data via an AMS system is cost effective.
Description of AMS data about udder traits
In AMS information is stored about the positions of teats to be able to attach the milk cups in a short time. The storage or information of the teat positions can be different across manufacturers, but at the end the positions of all four teats are determined by an AMS and are stored.
Based on teat positions, five different udder traits can be derived. Each milking record contained Cartesian coordinates (x, y, z) of each of the 4 teats, indicating the 3-dimensional location of the teat tips. The z-coordinate is a measure of the distance from the teat tip to the floor, the y-coordinate is a measure of the position of the teat on the axis parallel to the long side of the robot, and the x-coordinate is a measure of the position of the teat on the axis perpendicular to the long side of the robot. The Cartesian teat coordinates in the AMS data set can be used to calculate the udder conformation traits: rear teat distance (RTD), front teat distance (FTD), udder depth (UD), distance between front and rear teats (DRF) and udder balance (UB, the difference in depth between front and rear udder). A specification of the udder conformation traits and equations for calculation are given in Table 3.
The trait rear teat distance is similar to rear teat placement, and front teat distance is similar to the trait front teat placement. Rear teat placement, front teat placement and udder depth are currently in the ICAR list of conformation traits for dairy and dual purpose cattle.
Table 3. Calculation of udder conformation traits based on teat positions measured by AMS.
| Udder trait | Description | Calculation1 |
| UD | Average distance of teat ends to the floor in mm | (Zlf + Zrf + Zlr + Zrr)/4 |
| FTD | Distance between left and right front teat ends in mm | Xlf - Xrf |
| RTD | Distance between left and right rear teat ends in mm | Xlr - Xrr |
| UB | Average difference in distance to the floor between the front and rear teat ends in mm | (Zlr + Zrr)/2 - (Zlf + Zrf)/2 |
| DRF | Average distance between the front and rear teat ends in mm | (Ylf + Yrr)/2 - (Ylf + Yrf)/2 |
1 Z = Z-coordinate, Y = Y-coordinate, X = X-coordinate, lf = left front, rf = right front, lr = left rear, rr = right rear.
Edits screening AMS data
When AMS data is used for analysis, checks need to be applied. Recommended edits are:
- Milking is not a failure or not refused;
- Milk yield is larger than 0 kg;
- Teat positions are known;
- Measures of z-coordinates (distance teat - floor) larger than 0 mm;
- Distances between left front and rear or right front and rear larger than 0 mm;
- Distance between left and right rear teats larger than -30 mm1;
- Distance between left and right front teats larger than 0 mm;
- Observation deviates less than 4 standard deviations from the expected observation of an animal;
- At least 5 hours interval with previous milking;
- Measurements are available on all four teats. So, data of cows with less than four milking quarters has to be removed.
A negative distance is possible in case of crossing teats. The distance depends on the order of attaching the cups, if for example the left teat is stored as left teat or as right teat.
Fields required using information form AMS:
- Animal id;
- Herd id;
- Date and time of miking;
- x, y, z coordinates;
- Milk yield;
- Information on success of milking.
Analysis of data in genetic evaluation
From the AMS, information of every separate milking more than 700 measurements are made available during a lactation. To analyze the data in genetic evaluations several options are possible:
- Usage of all measurements.
- Usage of every xth measurement.
- Usage of average of n-measurements (e.g. 10) or of a certain period (e.g. week).
Considerations
- Determined teat positions are actually the position of teat ends. In case trait udder depth is derived from teat positions, one also should or could consider teat length to get a more exact measure of udder depth. This correction only is possible in case the AMS system is also determining teat length.
- Further it should be noticed that stature of the cow affects the distance from floor to udder (z coordinate). It also should be noticed that scoring udder depth by classifiers, udder depth is scored in relation to the hock (as reference point). This also results in the situation that udder depth scored by classifiers is also affected by stature.
- When using udder depth data from AMS for genetic evaluation one always should check the genetic correlation between udder depth scored by classifiers and udder depth based on AMS data. A way to improve the genetic correlation is to add the breeding value for stature and teat length as extra effects to the model for udder depth based on AMS data.
- In the future, data from AMS might also become available from udder traits like teat length, teat direction or teat thickness.
References
- ↑ Byskov, K., L. H. Buch, and G. P. Aamand. 2012. Possibilities of implementing measures from automatic milking systems in routine evaluations of udder conformation and milking speed. Interbull Bull. 46:28–32.
- ↑ Poppe, M., H.A. Mulder, B.J. Ducro, and G. de Jong, 2019. Genetic analysis of udder conformation traits derived from automatic milking system recording in dairy cows. J. Dairy Sci. 102:1386–1396.
Appendix 1: The standard trait definition for dairy cattle
Approved standard traits
- 1. Stature
- 2. Chest Width
- 3. Body Depth
- 4. Rib Structure
- 5. Rump Angle
- 6. Rump Width
- 7. Rear Legs Set
- 8. Rear Legs Rear View
- 9. Foot Angle
- 10. Fore Udder Attachment
- 11. Rear Udder Height
- 12. Central Ligament
- 13. Udder Depth
- 14. Front Teat Placement
- 15. Teat Length
- 16. Rear Teat Placement
- 17. Locomotion
- 18. Body condition score
Common standard traits
- 19. Hock development
- 20. Bone structure
- 21. Rear udder width
- 22. Teat thickness
- 23. Muscularity
Standard trait definition
The precise description of each trait is well defined and it is essential that the full range of linear scores to identify the intermediate and extremes of each trait be used. The assessment parameters for the calculations should be based on the expected biological extremes of a cow in the first lactation. The scale must cover the biological extremes of the current population.
Recommended Scale 1 - 9
Note: The linear scale used, must cover the expected biological extremes of the population in the country of assessment.
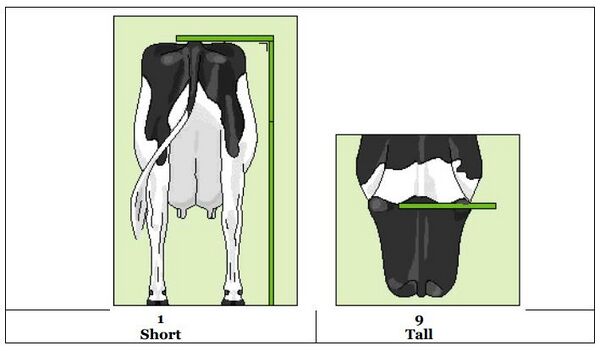
Stature
Reference point: Measured from the top of the spine in between hips to ground. Precise measurement in centimetres or inches, or linear scale.
1 - Short
5 - Intermediate
9 - Tall
Chest width
Reference point: Measured from the inside surface between the top of the front legs.
1 - Narrow
5 - Intermediate
9 - Wide

Body depth
Reference point: Distance between top of spine and bottom of barrel at last rib - the deepest point: independent of stature.
1 - Shallow
5 - Intermediate
9 . Deep

Rib Structure
Reference point: The spring and angle of the ribs (60/40). Not a true linear trait.
1 - Little spring of ribs, ribs are facing down
5 - Intermediate
9 - Much spring of ribs and ribs are pointing rearward
Reference scale: weighing of the two components; angle and spring of the ribs. The best way to score spring, the arch of the ribs, is looking at the cow from behind. Direction of the ribs is scored looking at the cow from the side. Openness is not part of the definition.
Do the measurement on the left side of the body.
Rear view:

Side view:

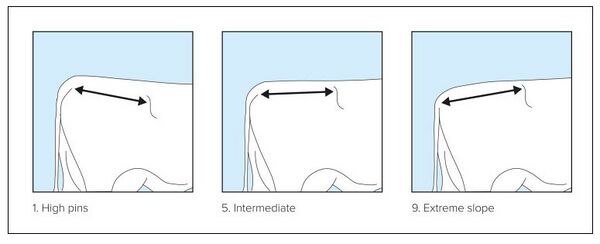
Rump Angle
Reference point: Measured as the angle of the rump structure from hooks (hips) to pins.
1 - High Pins
5 - Intermediate
9 - Extreme slope
Depending on the population rump angle can be scored level with a score in the range of 3-5.

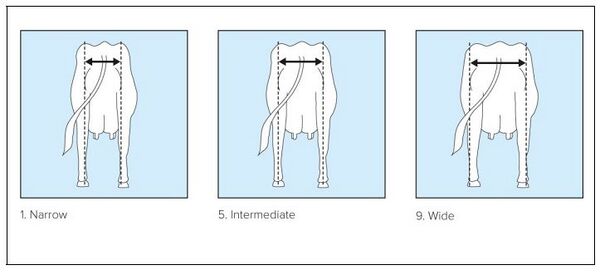
Rump width
Reference point: The distance between the most posterior point of pin bones.
1 - Narrow
5 - Intermediate
9 - Wide

Rear legs rear view
Reference point: Direction of rear feet when viewed from the rear.
1 - Extreme toe-out
5 - Intermediate; slight toe-out
9 - Parallel feet

Rear legs set
Reference point: Angle measured at the front of the hock.
1 - Straight
5 - Intermediate
9 - Sickled
If the rear legs set is different, the most extreme one should be scored.

Foot angle
Reference point: Angle at the front of the rear hoof measured from the floor to the hairline at the right hoof.
1 - Very low angle
5 - Intermediate
9 - Very steep
If the foot angle is different, the most extreme one should be scored.
If the foot angle is difficult to score because of hoof trimming, bedding, manure etc. It is also possible to look at the angle of hairline.

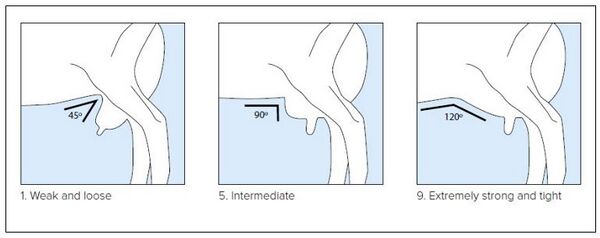
Fore udder attachment
Reference point: The strength of attachment of the fore udder to the abdominal wall.
Not a true linear trait.
1 - Weak and loose
5 - Intermediate
9 - Extremely strong and tight

Front Teat Placement
Reference point: The position of the front teat from the centre of quarter as viewed from the rear.
1 - Outside of quarter
5 - Intermediate
9 - Inside of quarter

Teat length
Reference point: The length of the front teat.
1 - Short
5 - Intermediate
9 - Long
Instead of scoring front teat, the rear teat can be scored. The choice of front teat or rear teat should be consistent in the whole system.

Udder depth
Reference point: The distance from the lowest part of the udder floor to the hock.
1 - Deep
5 - Intermediate
9 - Shallow
Potential point of reference is the level with the hock.

Rear udder Height
Reference point: The distance between the bottom of the vulva and the milk secreting tissue: in relation to the height of the animal.
1 - Low
5 - Intermediate
9 - High

Central ligament
Reference point: The depth of cleft at the base of the rear udder.
1 - Convex to flat floor (flat), broken ligament
5 - Intermediate
9 - Deep cleft/strong ligament

Rear teat placement
Reference point: The position of the rear teat from the centre of quarter:
1 - Outside of quarter
5 - Intermediate
9 - Inside of quarter

Locomotion
Reference point: The use of legs and feet, length and direction of the step.
1 - Severe Abduction - Short Stride
5 - Slight Abduction - Medium Stride
9 - No Abduction - Long stride
Score only if the cow can walk (cow has no lameness).

Body condition score
Reference point: The covering of fat over the tail head & rump. Not a true linear trait.
1 - Poor
5 - Intermediate
9 - Grossly fat
With a score from 1-6 there mainly has to be looked at the loin, while the tail implant is important with the higher score (7-9).

Hock development
Reference point: Cleanness and dryness of the hock.
1 - Hock with a lot of fluid
5 - Intermediate
9 - Complete clean and dry

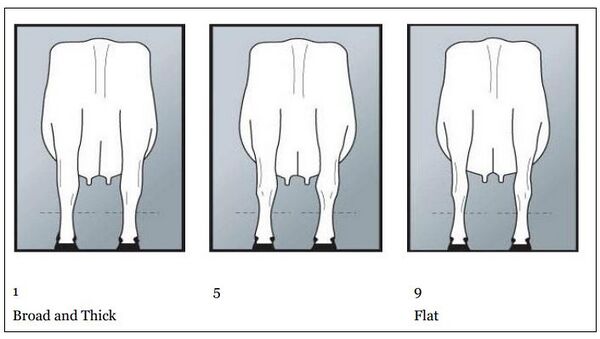
Bone structure
Reference point: The thickness and width of the bone structure, assessed by both examining the rear leg from the rear and from the side.
1 - Broad and thick
5 - Intermediate
9 - Flat
Rear udder width
Reference point: Width of the udder at the point where the milk secretion tissue is attached to the body.
1 - Narrow
5 - Intermediate
9 - Wide

Teat thickness
Reference point: Thickness of the teat in the middle of the front teat.
1 - Thin
5 - Intermediate
9 - Thick
Muscularity
Reference point: The amount of muscles as seen in the loins and thighs. Not a linear trait.
1 - Poor
5 - Intermediate
9 - Grossly muscular

Udder balance
Reference point: Levelness of udder floor.
1 – Rear deeper
5 – Intermediate
9 – Front deeper
The trait is assessed from the side where the deepest point of the rear udder floor is compared to the deepest point of the front udder floor.
In case there is a difference between both sides, score the most natural side.

Front feet orientation
Reference point: The orientation of the front feet, scored from behind the cow.
1 – Toes extremely out
5 – Intermediate
9 – Toes parallel

Loin strength
Reference point: Strength of the loin
1 – Weak
5 – Intermediate
9 - Strong
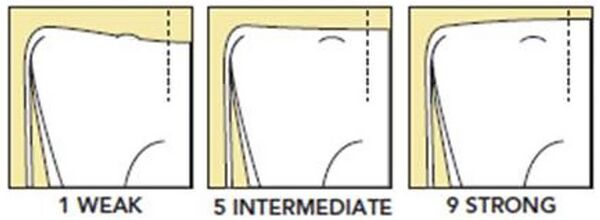
Appendix 2: The standard trait definition for dual purpose cattle
Approved Standard Traits
- 1. Stature
- 2. Chest Width
- 3. Body Depth
- 4. Rump Angle
- 5. Rump Width
- 6. Rump Length
- 7. Muscularity
- 8. Rear Legs Set
- 9. Hock Development
- 10. Foot Angle
- 11. Locomotion
- 12. Fore Udder Attachment
- 13. Rear Udder Height
- 14. Central Ligament
- 15. Udder Depth
- 16. Fore Udder Length
- 17. Front Teat Placement
- 18. Teat Length
- 19. Teat Thickness
- 20. Rear Teat Placement
- 21. Teat Direction
Standard trait definition
The precise description of each trait is well defined and it is essential that the full range of linear scores to identify the intermediate and extremes of each trait be used. The assessment parameters for the calculations should be based on the expected biological extremes of a cow in the first lactation. The scale must cover the biological extremes of the current population.
Recommended Scale 1 - 9
Note: The linear scale used, must cover the expected biological extremes of the population in the country of assessment.
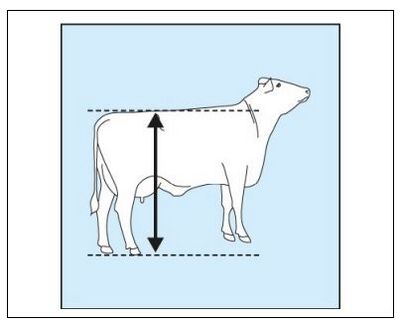
Stature
Reference point: Measured from the top of the spine in between hips to ground. Precise measurement in centimetres or inches, or linear scale.
1 - Short
5 - Intermediate
9 - Tall
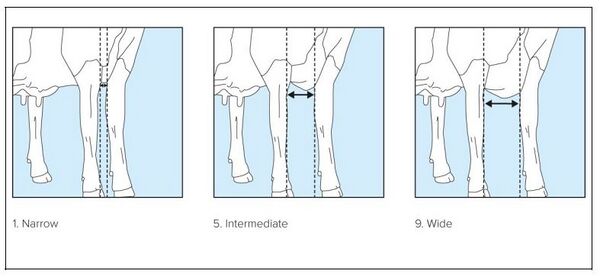
Chest width
Reference point: Measured from the inside surface between the top of the front legs.
1 - Narrow
5 - Intermediate
9 - Wide
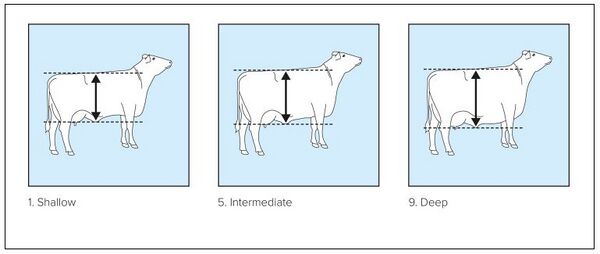
Body depth
Reference point: Distance between top of spine and bottom of barrel at last rib - the deepest point: independent of stature.
1 - Shallow
5 - Intermediate
9 - Deep
Rump angle
Reference point: Measured as the angle of the rump structure from hooks (hips) to pins.
1 - High Pins
5 - Intermediate
9 - Extreme slope
Depending on the population rump angle can be scored level with a score in the range of 3-5.
Rump width
Reference point: The distance between the most posterior point of pin bones.
1 - Narrow
5 - Intermediate
9 - Wide
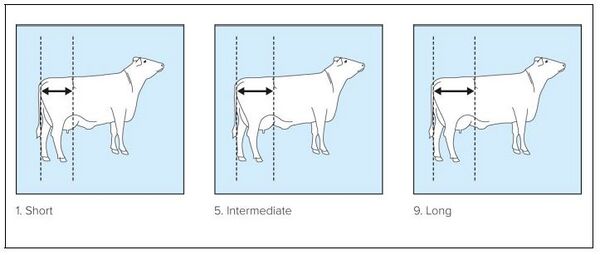
Rump length
Reference point: The distance between beginning (front) of the hip bone and the end (rear) of the pin bone.
1 - Short
5 - Intermediate
9 - Long
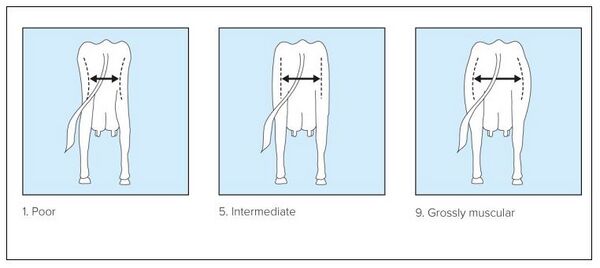
Muscularity
Reference point: The amount of muscles as seen in the loins and thighs. Not a linear trait.
1 - Poor
5 - Intermediate
9 - Grossly muscular
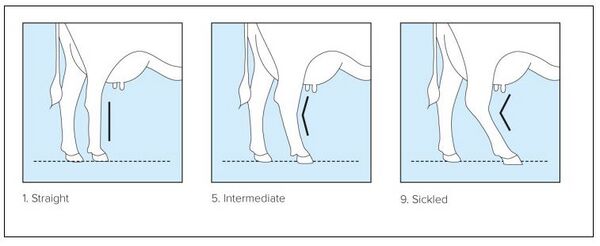
Rear legs set
Reference point: Angle measured at the front of the hock.
1 - Straight
5 - Intermediate
9 - SickledIf the rear legs set is different, the most extreme one should be scored.
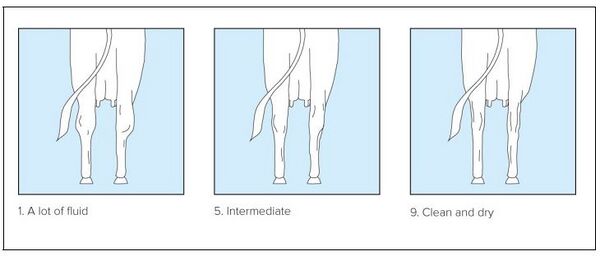
Hock development
Reference point: Cleanness and dryness of the hock.
1 - Hock with a lot of fluid
5 - Intermediate
9 - Complete clean and dry
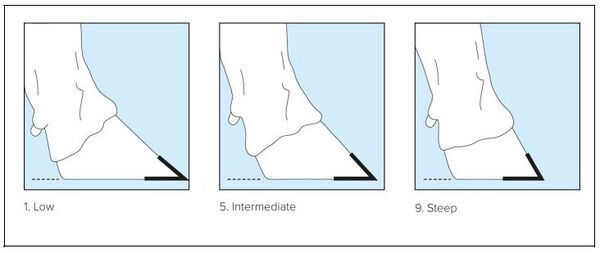
Foot angle
Reference point: Angle at the front of the rear hoof measured from the floor to the hairline at the right hoof.
1 - Very low angle
5 - Intermediate
9 - Very steep
If the foot angle is different, the most extreme one should be scored. If the foot angle is difficult to score because of hoof trimming, bedding, manure etc. It is also possible to look at the angle of hairline.
Locomotion
Reference point: The use of legs and feet, length and direction of the step.
1 - Severe abduction - Short stride
5 - Slight abduction - Medium stride
9 - No abduction - Long stride
Score only if the cow can walk (cow has no lameness).

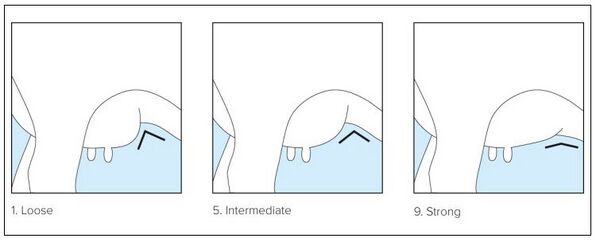
Fore udder attachment
Reference point: The strength of attachment of the fore udder to the abdominal wall. Not a true linear trait.
1 - Weak and loose
5 - Intermediate
9 - Extremely strong and tight
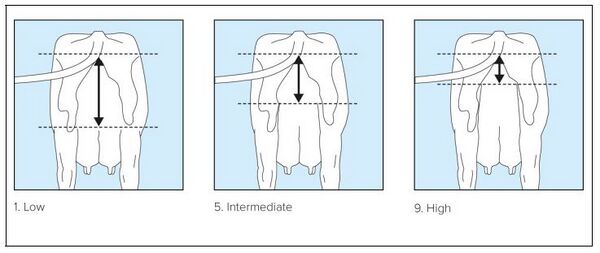
Rear udder height
Reference point: The distance between the bottom of the vulva and the milk secreting tissue: in relation to the height of the animal.
1 - Low
5 - Intermediate
9 - High
Central ligament
Reference point: The depth of cleft at the base of the rear udder.
1 - Convex to flat floor (flat), broken ligament
5 - Intermediate
9 - Deep cleft/strong ligament

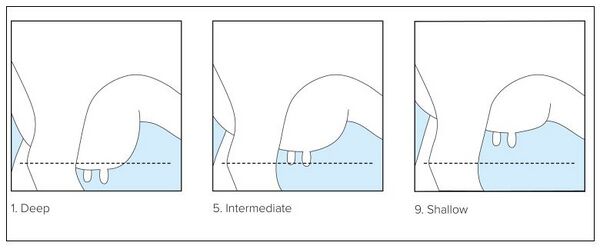
Udder depth
Reference point: The distance from the lowest part of the udder floor to the hock.
1 - Deep
5 - Intermediate
9 - Shallow
Potential point of reference is the level with the hock.
Fore udder length
Reference point: The distance between attachment point. of udder to abdominal wall to the midpoint between front and rear teat.
1 - Short
5 - Intermediate
9 - Long

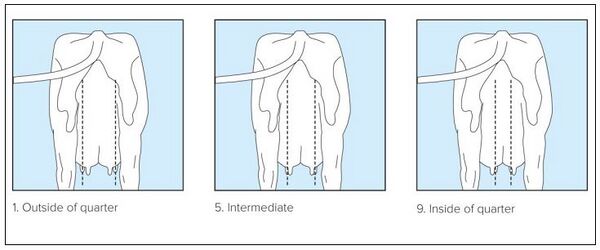
Front teat placement
Reference point: The position of the front teat from the centre of quarter as viewed from the rear.
1 - Outside of quarter
5 - Intermediate
9 - Inside of quarter
Teat length
Reference point: The length of the front teat.
1 - Short
5 - Intermediate
9 - Long
Instead of scoring front teat, the rear teat can be scored. The choice of front teat or rear teat should be consistent in the whole system.

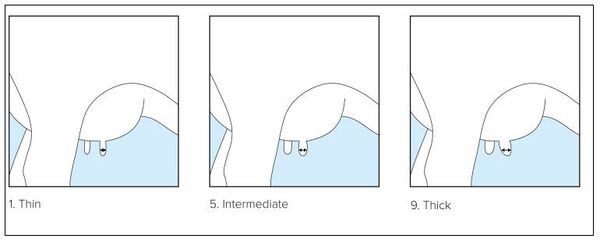
Teat thickness
Reference point: Thickness of the teat in the middle of the front teat.
1 - Thin
5 - Intermediate
9 - Thick
Rear teat placement
Reference point: The position of the rear teat from the centre of quarter.
1 - Outside of quarter
5 - Intermediate
9 - Inside of quarter

Teat direction
Reference point: The direction of the rear teats viewed from behind.
1 - Outside
5 - Intermediate
9 - Inside
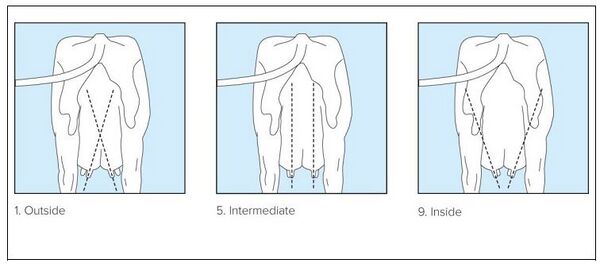
Appendix 3: The standard trait definition for beef breeds
Approved standard traits
Frame traits
- 1. Body Length
- 2. Back Length
- 3. Chest Width
- 4. Thurl Width
- 5. Body Depth
- 6. Chest Depth
- 7. Flank Depth
- 8. Length of Rump
- 9. Height at Withers
- 10. Height at rump
- 11. Rounding of ribs
- 12. Rump Angle
- 13. Tail Set
- 14. Width at Hips
- 15. Width at Pins
Muscularity traits
- 16. Muscularity Shoulder top view
- 17. Muscularity Shoulder side view
- 18. Back Width
- 19. Thickness of Loin
- 20. Thigh Rounding side view
- 21. Thigh Width rear view
- 22. Thigh Length
- 23. Body Condition Score
Type traits
- 24. Muzzle Width
- 25. Top Line
- 26. Skin Thickness
Leg traits
- 27. Front Legs front view
- 28. Fore Pasterns side view
- 29. Rear Legs rear view
- 30. Rear Legs side view
- 31. Hind Pasterns side view
- 32. Claw Angle
- 33. Thickness of Bone
Udder traits
- 34. Thickness of Teat
- 35. Teat Length
- 36. Udder Balance
- 37. Udder Depth
Standard trait definition
- The precise description of each trait is well defined and it is essential that the full range of linear scores to identify the intermediate and extremes of each trait be used. The assessment parameters for the calculations should be based on the expected biological extremes of the same category animals in terms of sex and age scored. The scale must cover the biological extremes of the current population or category. The extremes and the intermediates are ordered according to the degree of expression of the trait. For example thin and thick, long and short etc. A high or a low score has no particular meaning and it is not necessarily desirable or undesirable.
- Recommended Scale 1 - 9
- Note: The linear scale used, must cover the expected biological extremes of the population in the country of assessment.
Body length
Reference point: Length from shoulder to pins.
1 - Short
5 - Intermediate
9 - Long
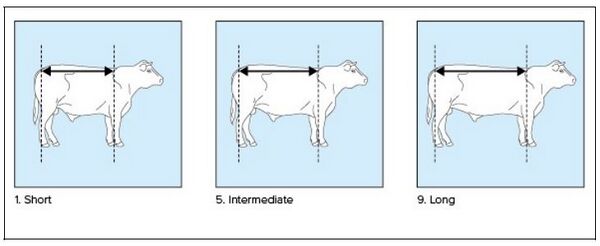
Back length
Reference point: Length from shoulder to hips.
1 - Short
5 - Intermediate
9 - Long
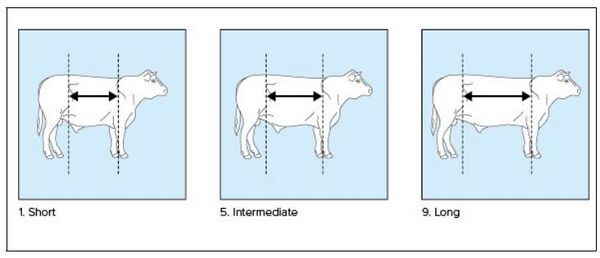
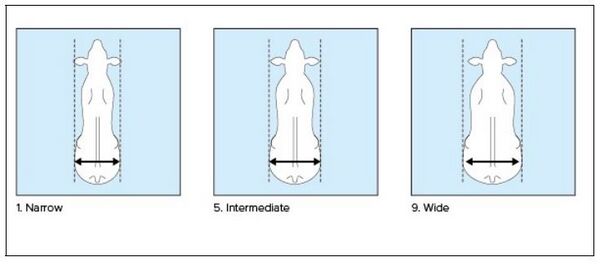
Chest width
Reference point: Measured from the inside surface between the top of the front legs.
1 - Narrow
5 - Intermediate
9 - Wide
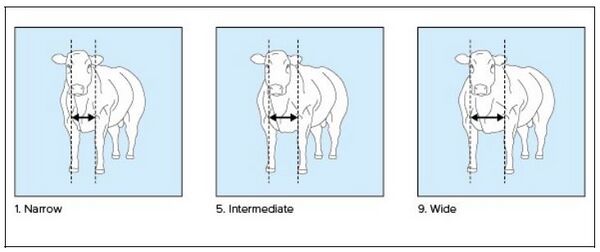
Thurl width
Reference point: Distance between thurls.
1 - Narrow
5 - Intermediate
9 - Wide
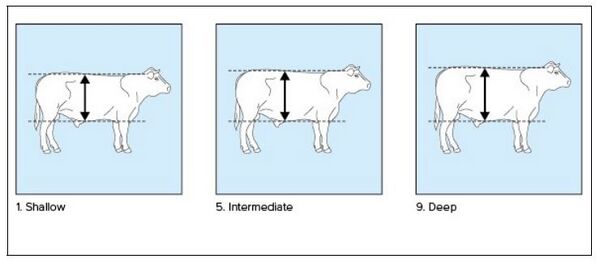
Body depth
Reference point: Distance between top of back and bottom of barrel at the deepest point: independent of stature.
1 - Shallow
5 - Intermediate
9 - Deep
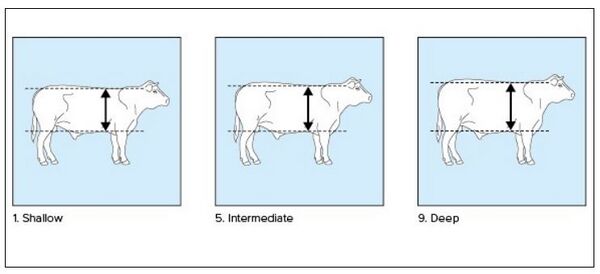
Chest depth
Reference point: Distance between top of back just behind shoulder and bottom of barrel behind the front leg.
1 - Shallow
5 - Intermediate
9 - Deep
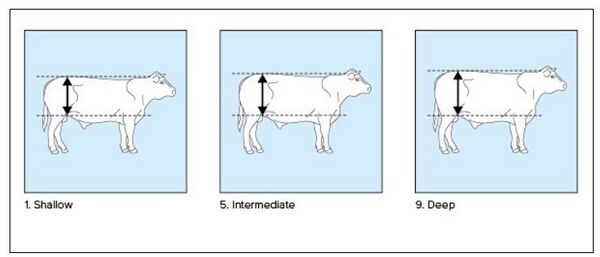
Flank depth
Reference point: Distance between top of back just before hips and bottom of barrel just before the rear leg.
1 - Shallow
5 - Intermediate
9 - Deep
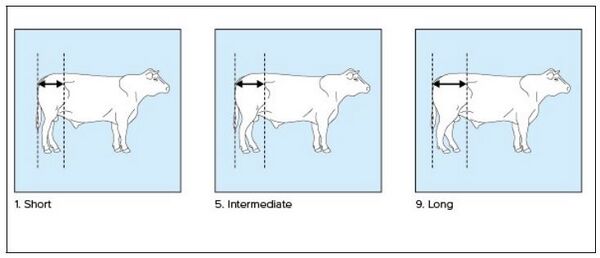
Length of ump
Reference point: Distance from hips to pins
1 - Short
5 - Intermediate
9 - Long
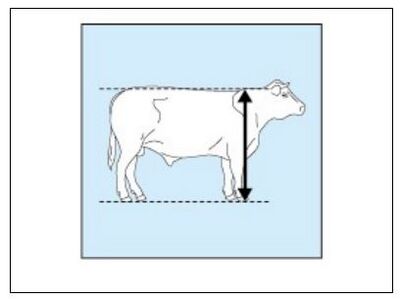
Height at withers
Reference point: Measured from the top of the back in between the shoulders to the ground.
1 - Short
5 - Intermediate
9 - Tall
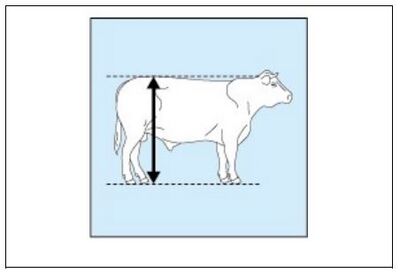
Height at rump
Reference point: Measured from the top of the back in between the hips to the ground.
1 - Short
5 - Intermediate
9 - Tall
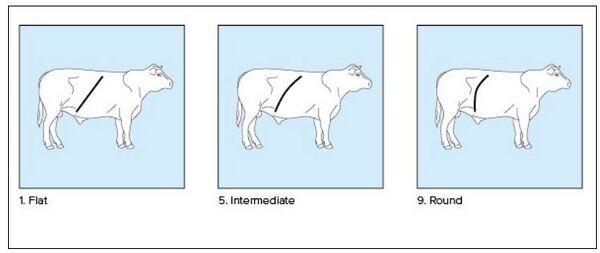
Rounding of ribs
Reference point: The curving of the ribs.
1 - Flat
5 - Intermediate
9 - Round
Rump angle
Reference point: Measured as the angle of the rump structure from hooks (hips) to pins.
1 - High pins
5 - Intermediate
9 - Extreme slope

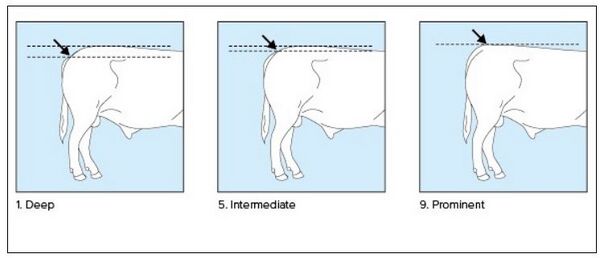
Tail set
Reference point: Insertion of the tail.
1 - Deep
5 - Intermediate
9 - Prominent
Width at hips
Reference point: Distance between the hips.
1 - Narrow
5 - Intermediate
9 - Wide

Width at pins
Reference point: Distance between the pins.
1 - Narrow
5 - Intermediate
9 - Wide

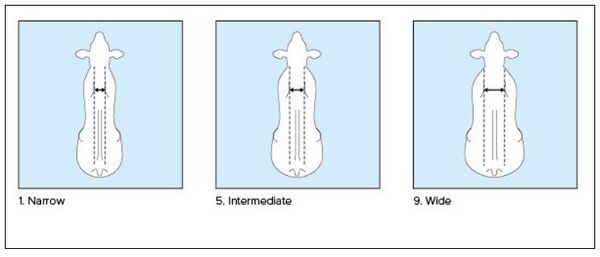
Muscularity shoulder top view
Reference point: Distance and muscularity between the tops of shoulders, top view.
1 - Narrow
5 - Intermediate
9 - Wide
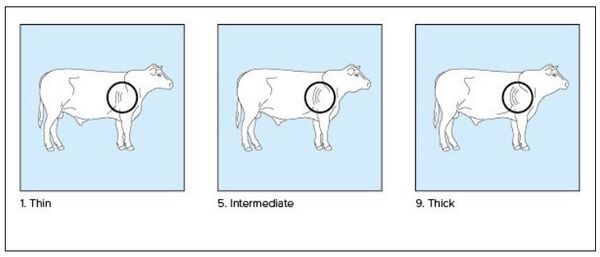
Muscularity shoulder side view
Reference point: Thickness of the muscles of the shoulders.
1 - Thin
5 - Intermediate
9 - Thick
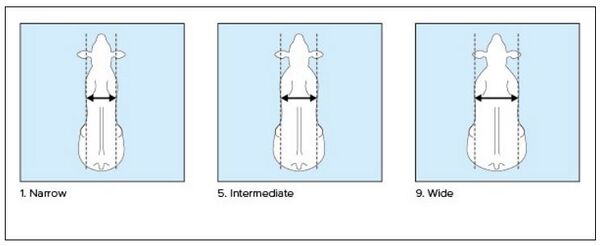
Back width
Reference point: Width of the back behind the shoulders.
1 - Narrow
5 - Intermediate
9 - Wide
Thickness of loin
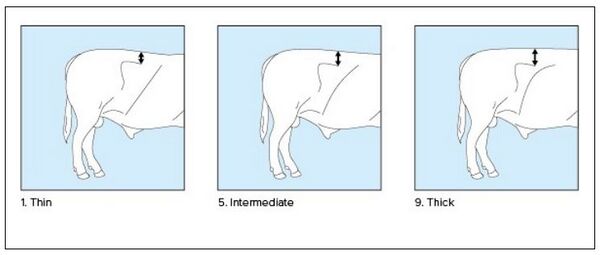
Reference point: Thickness of the loins just before the hips and after the last rib, side view on the right.
1 - Thin
5 - Intermediate
9 - Thick
Thigh rounding side view
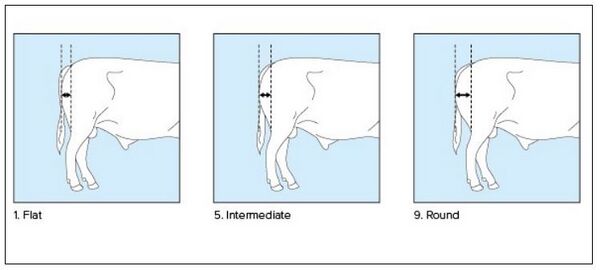
Reference point: Curving of the tight behind the vertical line between pins and hock, side view.
1 - Flat
5 - Intermediate
9 - Round
Thigh width rear view
Reference point: Width of the thighs, rear view, halfway. Represents the outside curving of the tights.
1 - Narrow
5 - Intermediate
9 - Wide

Thigh length
Reference point: Length of the thigh between pins and thigh attachment to the leg.
1 - Short
5 - Intermediate
9 - Long

Body condition score
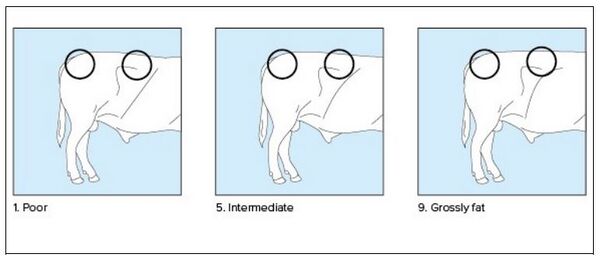
Reference point: The covering of fat over the tail head and rump. Not a true linear trait.
1 - Poor
5 - Intermediate
9 - Grossly fat
Muzzle width
Reference point: Width of the muzzle.
1 - Narrow
5 - Intermediate
9 - Wide

Top line
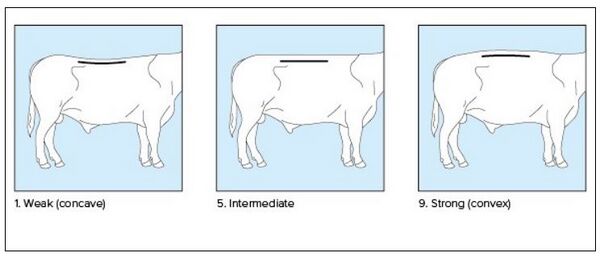
Reference point: Curving of the back between shoulders and hips.
1 - Weak (concave)
5 - Intermediate
9 - Strong (convex)
Skin thickness
Reference point: Thickness of skin.
1 - Thin
5 - Intermediate
9 - Thick
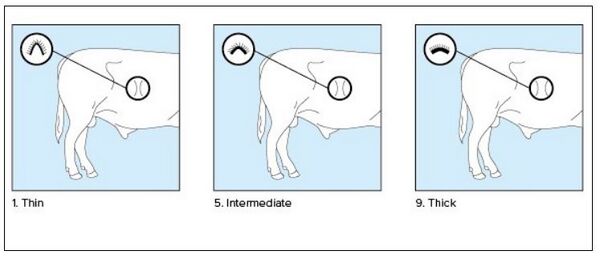
Front legs front view
Reference point: Direction of the feet of the forelegs viewed from the front.
1 - Toes in
5 - Intermediate
9 - Toes out

Fore pasterns side view
Reference point: Angle of the pasterns of fore legs with the floor.
1 - Low
5 - Intermediate
9 - Steep

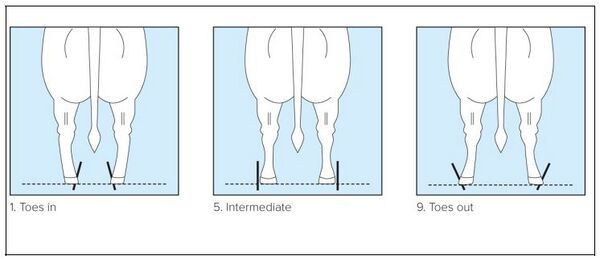
Rear legs rear view
Reference point: Direction of the feet of the rear legs, viewed from the rear.
1 - Toes in
5 - Intermediate
9 - Toes out
Rear legs side view
Reference point: Angle measured at the front of the hock.
1 - Straight
5 - Intermediate
9 - Sickled

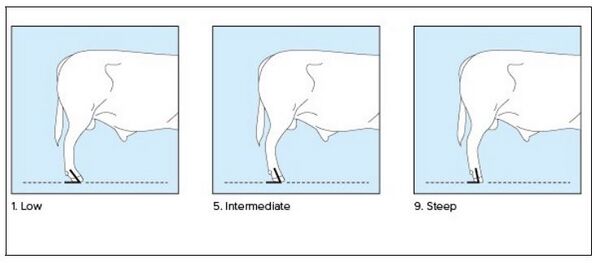
Hind pasterns side view
Reference point: Angle of the pasterns of the rear legs with the floor
1 - Low
5 - Intermediate
9 - Steep
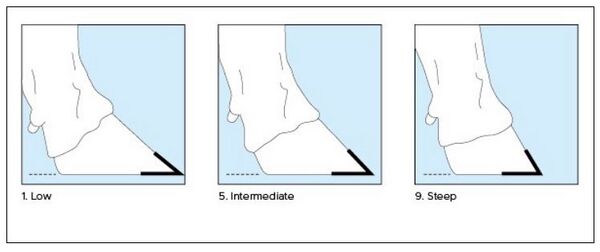
Claw angle
Reference point: Angle at the front of the rear hoof measured from the floor to the hairline.
1 - Low
5 - Intermediate
9 - Steep
Thickness of bone
Reference point: Thickness of the canon bone the forelegs.
1 - Thin
5 - Intermediate
9 - Thick
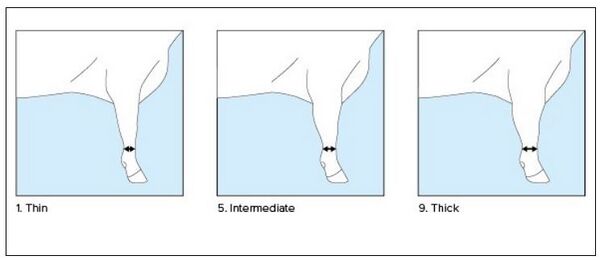
Thickness of teat
Reference point: Thickness of the teat in the middle of the front teat.
1 - Thin
5 - Intermediate
9 - Thick

Teat length
Reference point: The length of the front teat.
1 - Short
5 - Intermediate
9 - Long

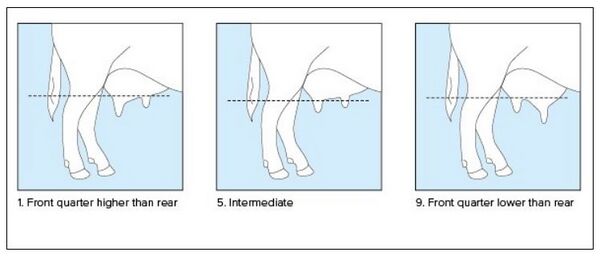
Udder balance
Reference point: The balance of the udder floor between front and rear udder.
1 - Front quarter higher than rear quarter
5 - Intermediate
9 - Front quarter lower than rear quarter
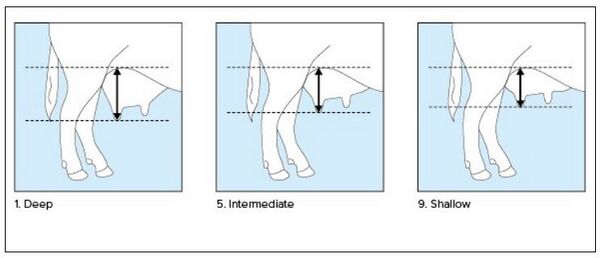
Udder depth
Reference point: The distance from the top of the udder to the lowest part of the udder floor, side view.
1 - Deep
5 - Intermediate
9 - Shallow
Appendix 4: The standard trait definition for Dairy Goats
Approved Standard Traits
Frame traits
- 1. Frame traits
- 2. Stature
- 3. Chest width
- 4. Body depth
- 5. Thurl width
- 6. Rump angle
- 7. Loin strength
- 8. Angularity
Leg traits
- 9. Rear legs rear view
- 10. Rear legs side view
- 11. Locomotion
Udder traits
- 12. Fore udder attachment
- 13. Rear udder height
- 14. Central ligament
- 15. Rear udder width
- 16. Udder depth
- 17. Teat placement rear view
- 18. Teat placement side view
- 19. Teat length
- 20. Teat form
Standard Trait Definition
The precise description of each trait is well defined and it is essential that the full range of linear scores to identify the intermediate and extremes of each trait be used. The assessment parameters for the calculations should be based on the expected biological extremes of the same category animals in terms of sex and age scored. The scale must cover the biological extremes of the current population or category. The extremes and the intermediates are ordered according to the degree of expression of the trait. For example thin and thick, long and short etc. A high or a low score has no particular meaning and it is not necessarily desirable or undesirable.
Recommended Scale 1 - 9
Note: The linear scale used, must cover the expected biological extremes of the population in the country of assessment.
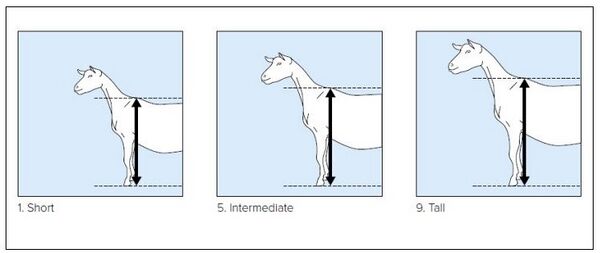
Stature
Reference point: Measured from the top of the spine in between the shoulders to ground. Precise measurement in centimeters or inches, or linear scale.
1 - Short
5 - Intermediate
9 - Tall
Chest width
Reference point: Measured form the inside surface between the top of the front legs.
1 - Narrow
5 - Intermediate
9 - Wide
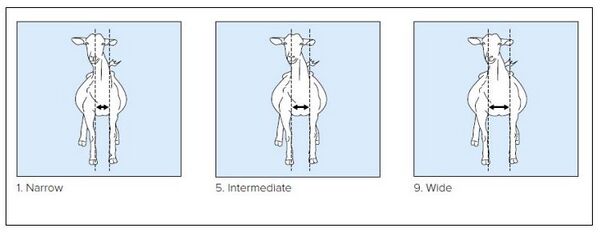
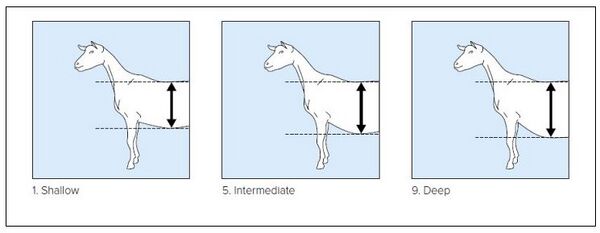
Body depth
Reference point: Distance between top of spine and bottom of barrel at last rib - the deepest point.
1 - Shallow
5 - Intermediate
9 - Deep
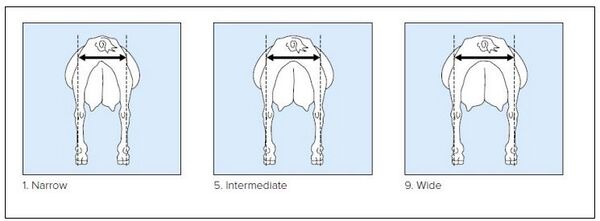
Thurl width
Reference point: Distance between thurls.
1 - Narrow
5 - Intermediate
9 - Wide
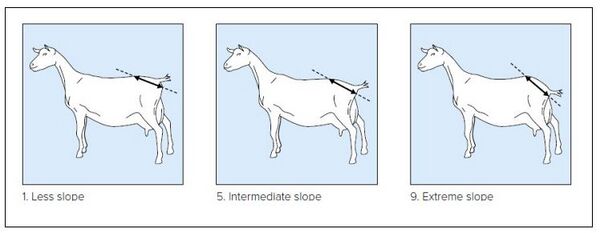
Rump angle
Reference point: Measured as the angle of the rump structure from hooks (hips) to pins.
1 - less slope
5 - Intermediate
9 - Extreme slope
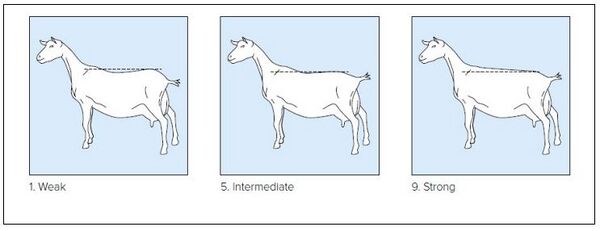
Loin strength
Reference point: Strength of vertebrae between back and rump.
1 - Weak
5 - Intermediate
9 - Strong
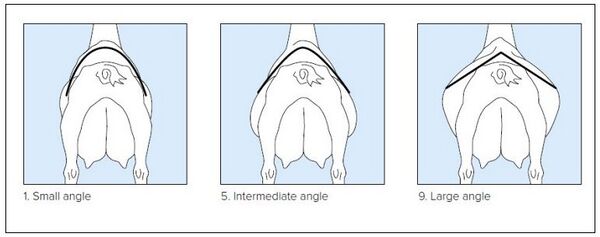
Angularity
Reference point: The spring of the ribs.
1 - Small angle
5 - Intermediate
9 - Large angle
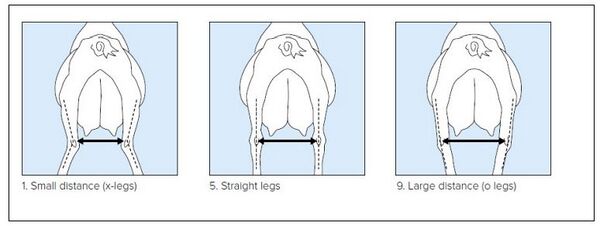
Rear legs set rear view
Reference point: Distance between the hocks.
1 - Small (x-legs)
5 - Intermediate
9 - Large (o-legs)
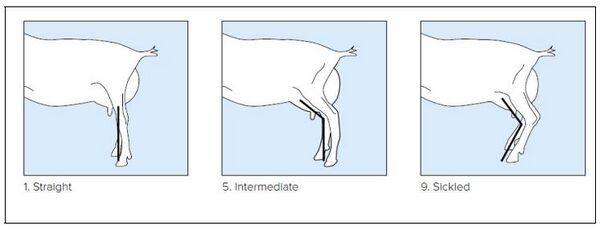
Rear legs set side view
Reference point: Angle measured at the front of the hock.
1 - Straight
5 - Intermediate
9 - Sickled
Locomotion
Reference point: The use of legs and feet, length and direction of the step.
1 - Severe abduction - short stride
5 - Slight abduction - medium stride
9 - No abduction - long stride

Fore udder attachment
Reference point: The strength of attachment of the fore udder to the abdominal wall. Not a true linear trait.
1 - Weak and loose
5 - Intermediate
9 - Extremely strong and tight
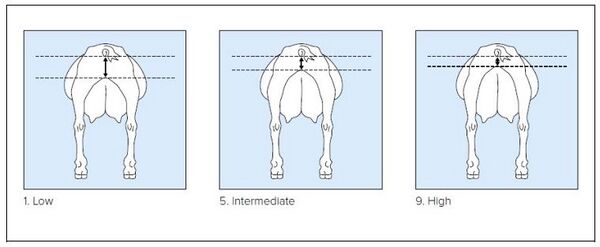
Rear udder height
Reference point: The distance between the bottom of the vulva and the milk secreting tissue.
1 - Low
5 - Intermediate
9 - High
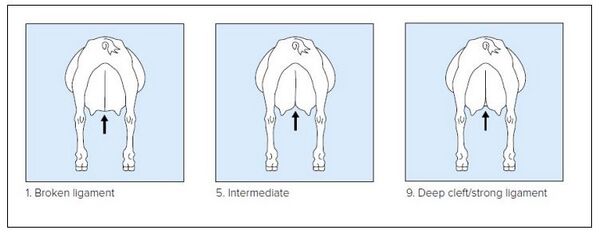
Central ligament
Reference point: The depth of cleft at the base of the rear udder.
1 - Convex to flat floor (flat), broken ligament
5 - Intermediate
9 - Deep cleft/strong ligament
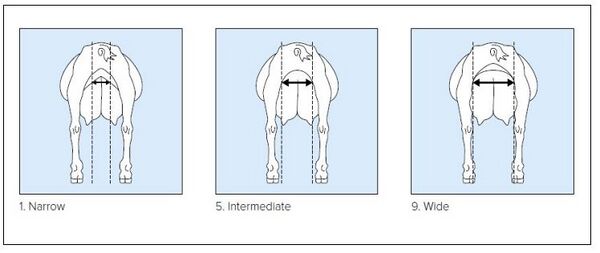
Rear udder width
Reference point: Width of the udder at the point where the milk secretion tissue is attached to the body.
1 - Narrow
5 - Intermediate
9 - Wide
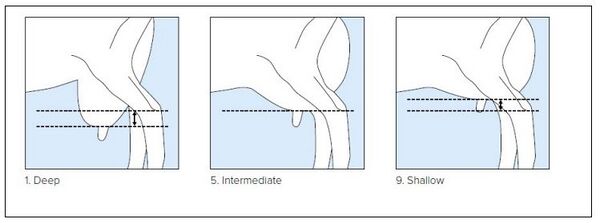
Udder depth
Reference point: The distance from the lowest part of the udder floor to the hock.
1 - deep
5 - Intermediate
9 - Shallow
Potential point of reference is the level with the hock.
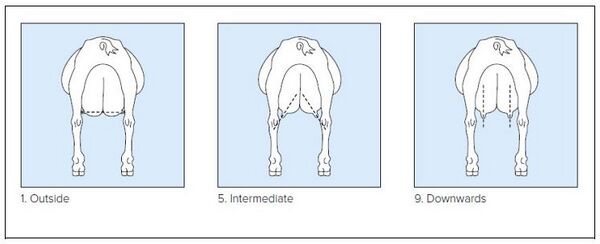
Teat placement rear view
Reference point: The direction of the teats in relation to the udder viewed from rear.
1 - Outside
5 - Intermediate
9 - Downwards
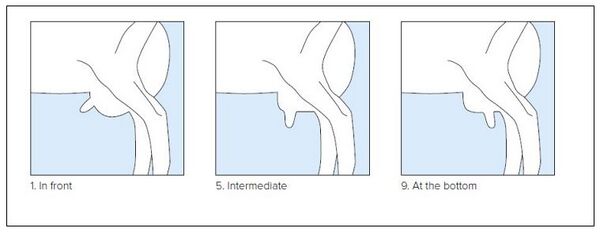
Teat placement side view
Reference point: The position of teat in udder viewed from the side.
1 - In front
5 - Intermediate
9 - At bottom
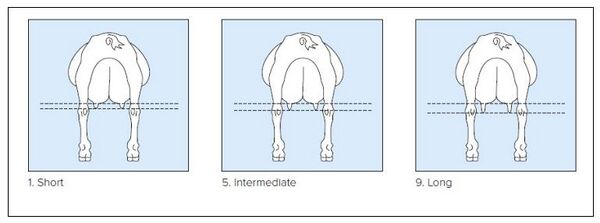
Teat length
Reference point: The length of the teat.
1 - Short
5 - Intermediate
9 - Long
Teat form
Reference point: The shape of the teat, from triangle to finger form, viewed from rear or from side.
1 - Triangle shape - wide
5 - Intermediate
9 - Finger shape - narrow

Appendix 5: Relationship between conformation and functional traits for dairy and dual purpose cattle
Introduction
In this appendix, the relationship between some of the ICAR standard conformation linear traits for dairy and dual-purpose cattle and health and longevity is described in detail. This information can be used to show farmers how the conformation scores can help him to breed a kind of cow which is able to perform the best in the herd.
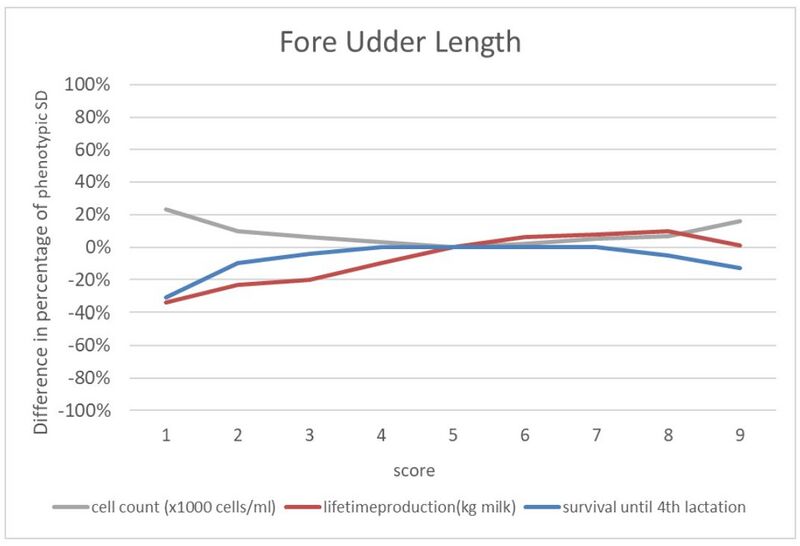
Results are presented as a deviation in percentage of the phenotypic standard deviation of 6 functional traits:
- Lifetime production: milk production during the whole productive life
- Survival: binary trait for reaching the 4th calving
- Somatic cell count: geometric mean of 1st lactation SCC
- Claw disorders: any disorder observed on the hoof for the disorders sole haemorrhage, digital dermatitis, interdigital dermatitis, sole ulcer, interdigital hyperplasia, and white line disease
- Interval from 1st to last insemination: interval in days between 1st to last insemination resulting in a gestation.
- Calving ease: calving score on a scale of 1 to 4 (easy to caesarean section) at the 1st calving. All animals in the analysis had the opportunity to have a productive life of at least 36 months.
Results are based on analyses conducted in 4 populations, three Holstein populations from Hungary, Netherlands and Switzerland, and the Fleckvieh population from Germany. Only 1st lactation classifications were used for the analysis. A more detailed description of the data can be found in Table 1.
The relationships found were very similar for the different populations. Therefore, for each conformation trait the relationship shown in this document is based on data of one population, which is indicated per trait in Table 1. Further, Table 1 shows the number of records used for every conformation trait – functional trait combination, as also the period of the scores.
| Table 1. Period and number of scores used for estimating the relationships between conformation and functional traits for cattle. | |||||||
| Trait | Country1 | Traits2 | |||||
| SURV | LP | INT | CE | CLAW | SCC | ||
| Period of scores3 | |||||||
| nld | 2010-2013 | 2014-2017 | 2015-2016 | ||||
| che | 9/2011 - 12/2016 | X | 9/2011-12/2016 | ||||
| deu | 10/2013 - 9/2014 | X | Cows born 2014-2016 | ||||
| Number of records | |||||||
| Stature | nld | 110922 | 117080 | 322532 | |||
| Chest width | nld | 110923 | 117120 | 322621 | |||
| Body depth | nld | 110923 | 117120 | 322621 | |||
| Angularity | nld | 110923 | 117120 | 322621 | |||
| Rump angle | nld | 110923 | 117120 | 322621 | 138638 | ||
| Rump width | nld | 110923 | 117120 | 322621 | 138639 | ||
| Body condition score | nld | 110923 | 117120 | 322621 | 138639 | ||
| Rear legs rear view | nld | 110923 | 117120 | 44617 | |||
| Rear legs set | nld | 110923 | 117120 | 44617 | |||
| Foot angle | nld | 110923 | 117120 | 44617 | |||
| Locomotion | nld | 109946 | 115816 | 44517 | |||
| Fore udder attachment | nld | 110923 | 117120 | 230127 | |||
| Front teat placement | nld | 110923 | 117120 | 230127 | |||
| Teat length | nld | 110923 | 117120 | 230127 | |||
| Udder depth | nld | 110923 | 117120 | 230127 | |||
| Rear udder height | nld | 110923 | 117120 | 230127 | |||
| Central ligament | nld | 110923 | 117120 | 230127 | |||
| Rear teat placement | nld | 110923 | 117120 | 230127 | |||
| Bone structure | che | 36979 | 36978 | ||||
| Rear udder width | che | 36979 | 36978 | 35318 | |||
| Muscularity | deu | 16572 | 39722 | ||||
| Fore udder length | deu | 16572 | 39722 | 97232 | |||
|
1 NLD = the Netherlands, CHE =
Switzerland, DEU = Germany. |
|||||||
Stature
Stature is clearly a trait with an intermediate optimum. Very small cows have a lower lifetime production. Their smaller size has no effect on the level of culling rate, so the lower lifetime production is more likely due to lower production per lactation. On the other side of the scale tall cows have a much lower survivability - possibly because of health issues related to their size - which in turn impacts their lifetime production.

Chest width
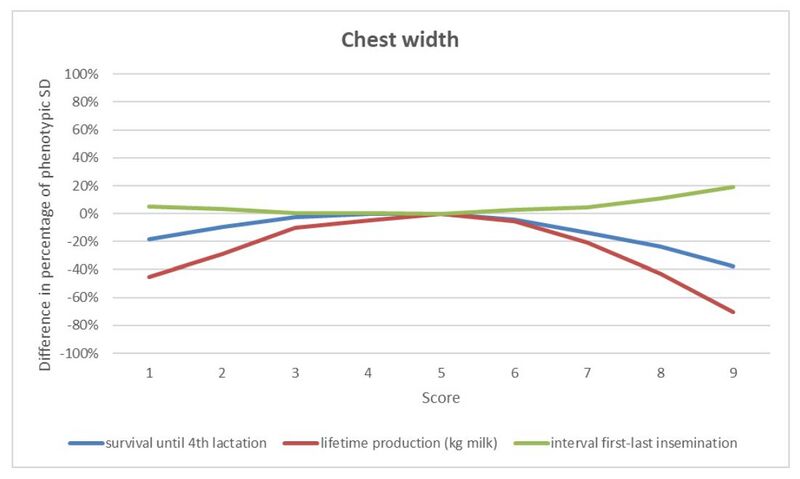
The graph shows, that both survival and lifetime production are decreasing when the linear score of the cows move down or up from the middle of the scale. When the chest is narrow the cow has not enough strength to ensure a good lifetime production and survival. When the chest is wider, the cows become “too wide”, they do not represent their age, they look like a mature cow in their young age. This influences the efficiency of the survival and through this, the lifetime production in a negative way.
Body depth
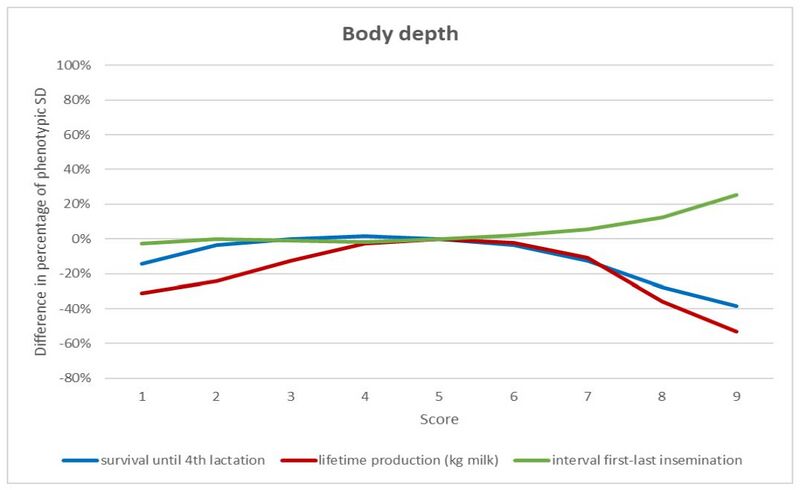
Body depth has an intermediate optimum in relation to survival and fertility. Deeper cows in 1st lactation, tend to have a reduced fertility (longer interval 1st to last insemination) and a shorter productive life, which results in a lower lifetime production. The effect of shallow cows is only a reduced lifetime production. Fertility does not seem to be hindered in those cows.
Angularity
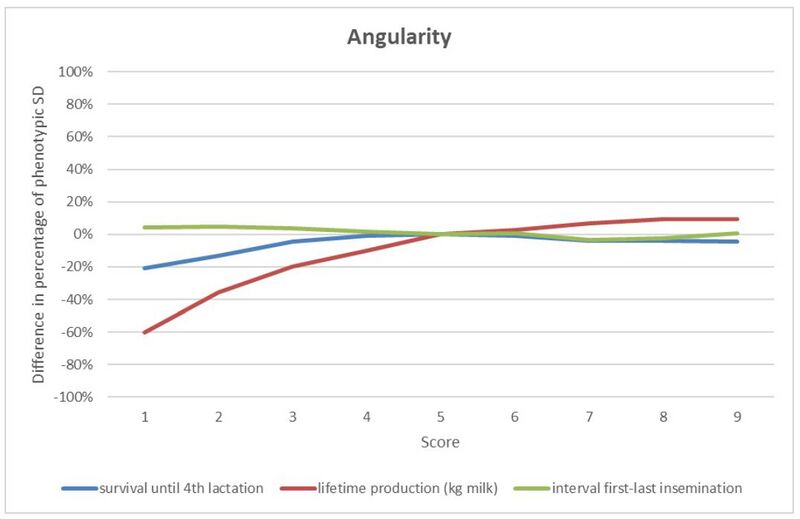
Angularity does not show any relationship with fertility. However, cows with a higher score for angularity have, on average, a higher lifetime production. This relationship is much stronger for Angularity scores below average than above average and is based on the highly positive relationship between production and angularity.
Rump angle
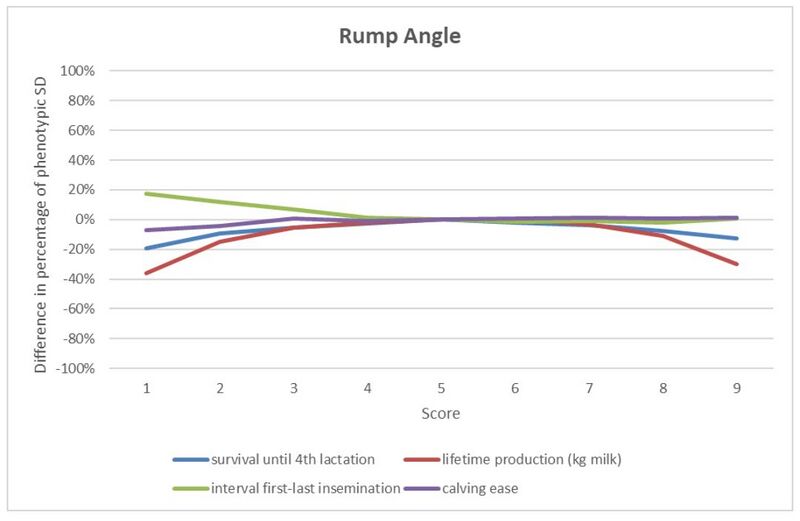
For most of the scale, Rump Angle does not have any strong relationship with the traits we analyzed. There is no relationship to calving ease. The relationship with survival is only present for extreme scores. This outcome shows that Rump Angle in relation to survival could be considered more as a defect, than a true linear trait.
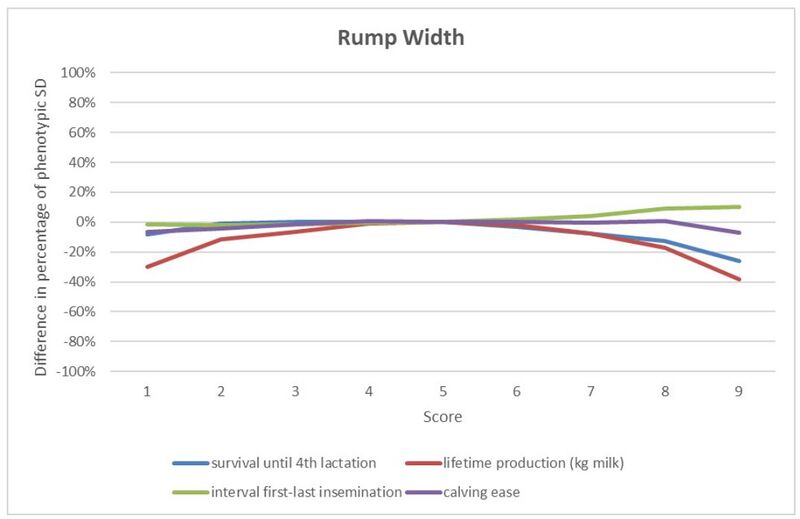
Rump width
As shown in the graph, the analyses did not detect any serious effect of Rump Width on calving ease. Beside this finding, extreme narrow rumps have a negative effect on lifetime production. The effect is larger for lifetime production than for survival. The reason might be that narrower rumps lead to narrower udders and lower milk production. On the other side wide-rumped cows are usually large cows. It has been shown that big cows have a reduced lifetime production and survival.
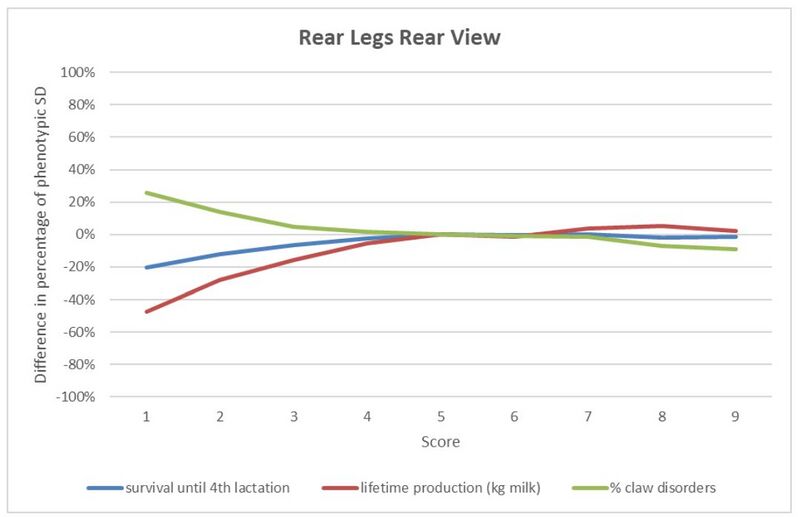
Rear legs rear view
There is a strong relation between hocked-in rear legs and claw disorders. Leg position with extreme toe-out implies a bad foot position. This can influence the susceptibility to claw diseases. It is probably this relationship that explains the reduced survival and lifetime production of cows with low score for Rear Legs Rear View. For above average score for Rear Legs Rear View there is no relation anymore with the three analyzed traits.
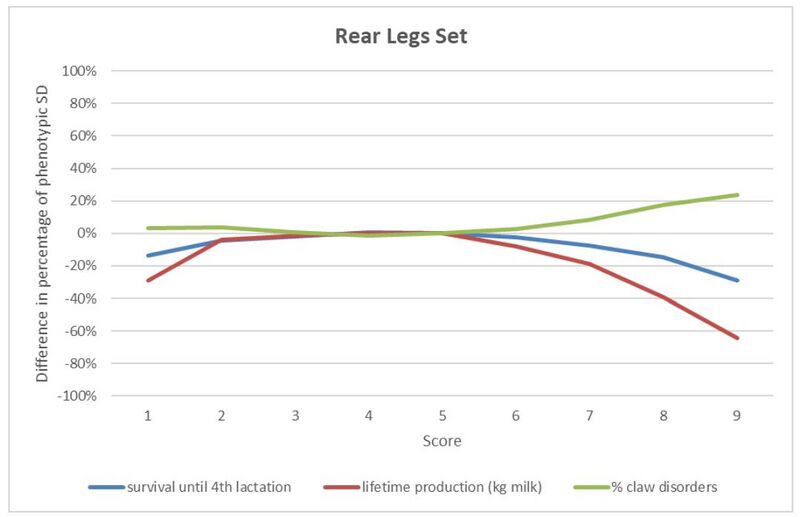
Rear legs set
Rear Legs Set is a trait with an intermediate optimum. Based on the data, both extremes, straight or sickled, show a tendency to reduced performance for functional traits. However, cows with sickled legs are more susceptible to claw problems and reduced lifetime production than those with straight legs.
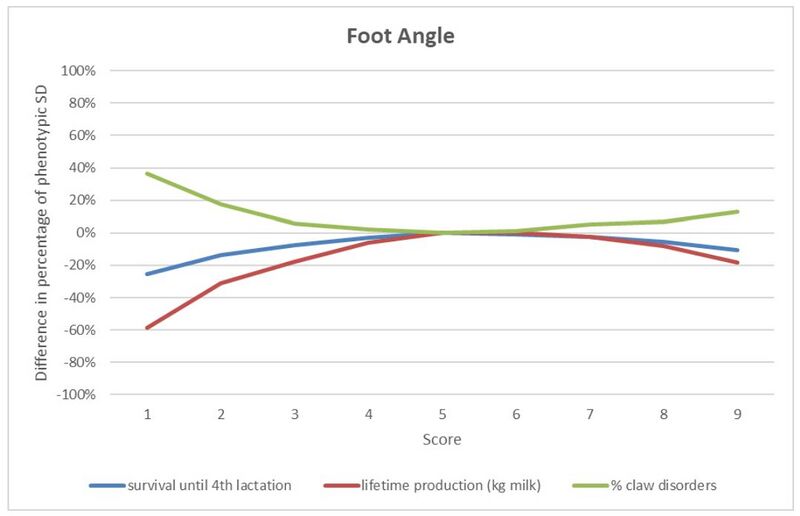
Foot angle
Cows with very low Foot Angle are much more susceptible to claw disorders than those with steeper Foot Angle. Steep Foot Angle is only a problem when it is extreme, especially a score for less than average angle. Survival and lifetime production are lower as well for cows with low Foot Angle.
Foot Angle is highly correlated with hoof height. Above average hoof height (more angle) will allow the weight of the cow to be more evenly distributed on the hoof and can lead to less claw disorders. Cows with higher hoofs are more stable in different conditions (slatted floor, pasture). The thickness of the heel prevents some injuries.
Fore udder attachment
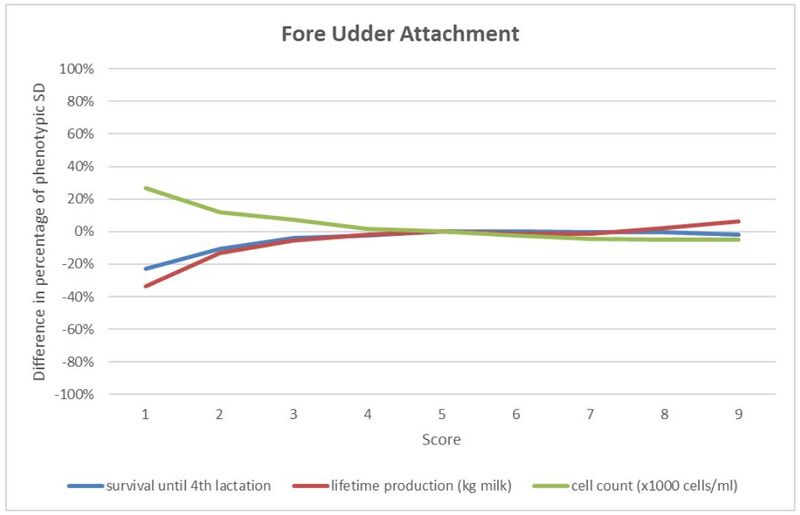
The Fore Udder Attachment does not have a large impact on udder health, survival or lifetime production, unless the attachment is very loose. For extreme loose Fore Udder Attachment an increase in somatic cell count is found.
Front teat placement
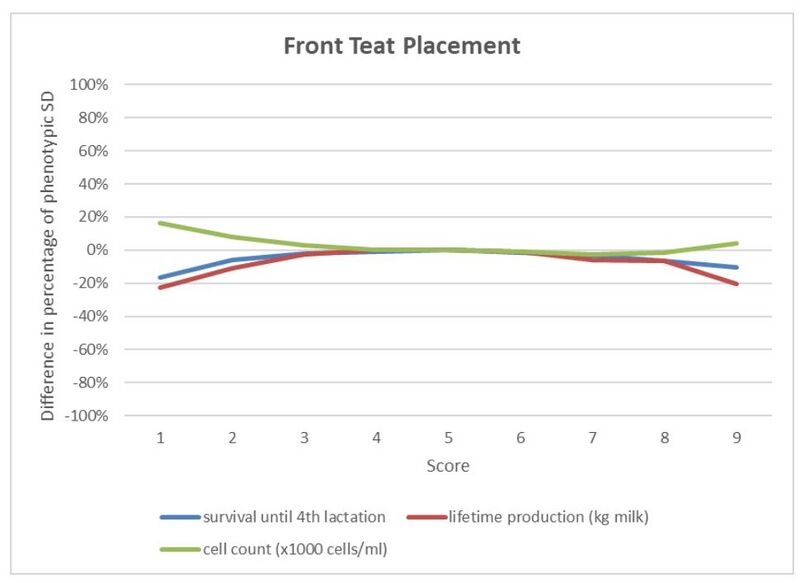
Front Teat Placement does not have a strong association with any of the analyzed traits, except for extreme scores. Low value, that is teats which are to the outside of the quarters are often seen with cows having higher cell count and lower survival. Milkability with conventional milking systems is hindered when teats are far apart. This aspect might lead to a higher cell count.
Teat length
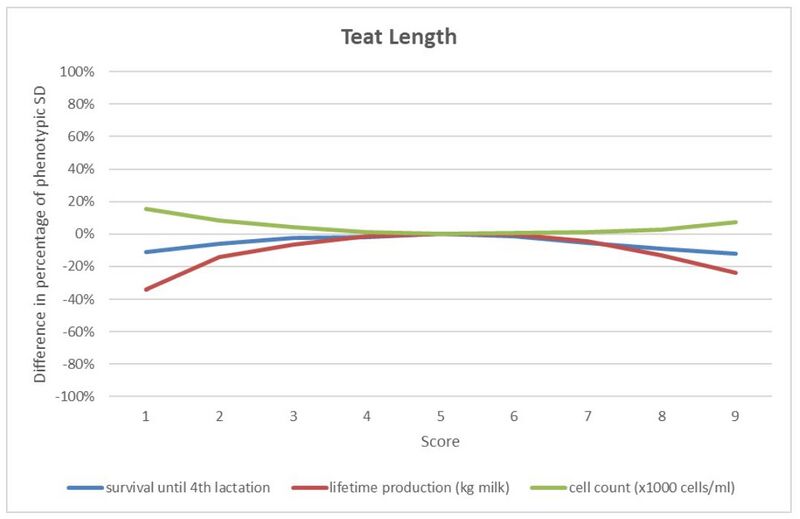
As for Front Teat Placement, Teat Length is a trait with an intermediate optimum. However, the effect on survival and lifetime production is more important. Short teats are linked to a shorter productive life. On the other end of the scale, long teats are linked as well to shorter productive life. The association might be caused by teats being more prone to injuries or to infections.
Udder depth
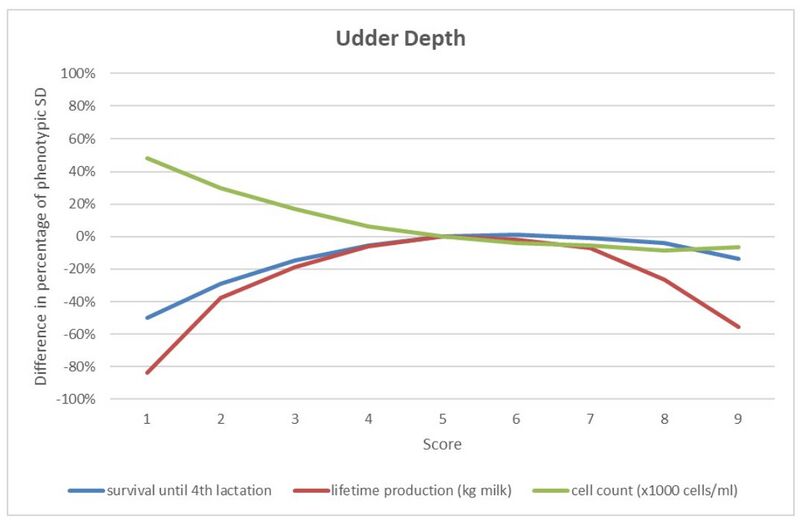
Udder depth is a trait with an intermediate optimum. It shows the most striking relation with health and longevity traits. A lower udder floor is related to a poor survival and lifetime production. Cows with this kind of udder are at higher risk of being culled as many difficulties might arise, such as udder health problems (also indicated by the higher somatic cell count), udder injuries, difficulties with the attachment of the milking machine, etc. The relationship at the high end of the scale (shallow udders) shows an interesting effect. Although survival remain high with higher udder floor, lifetime production plumets. Cows with a high score, are usually poor producers. Even though they live a rather long productive life, their lifetime production remains low.
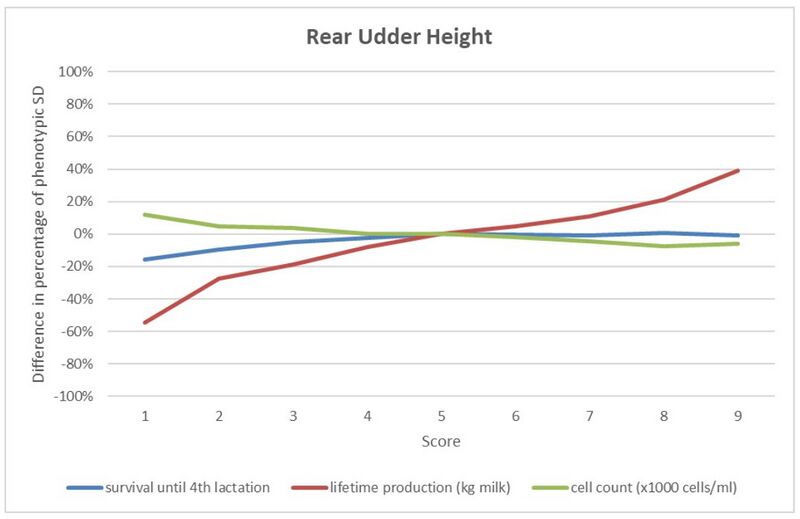
Rear udder height
The association between lifetime production and Rear Udder Height is positive and nearly linear. The reason is to be found in a positive relationship with milk production, as there is more room to produce milk. But at the same time, higher rear udder makes it possible to have larger udders without lowering udder depth. These 2 elements combined result in not only a better lactation production, but rather a larger lifetime production. The association with survival and somatic cell count is minor.
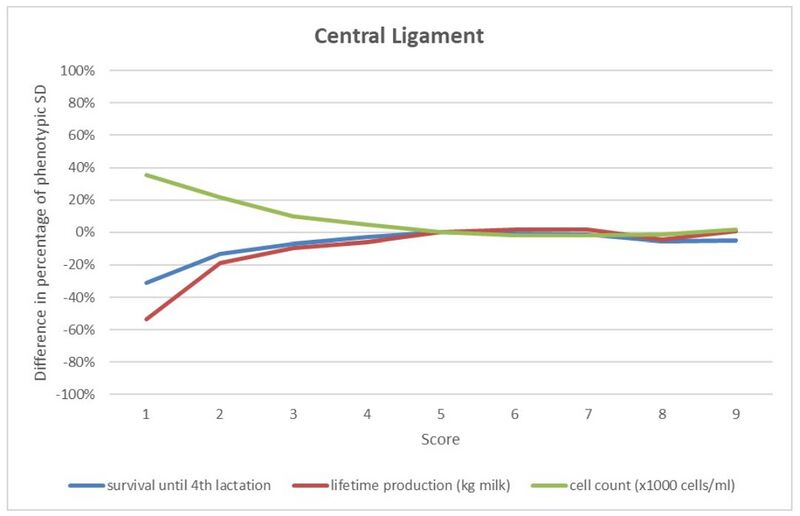
Central ligament
A strong Central Ligament is necessary to ensure that the udder is able to produce milk during a long time without becoming too deep after a several lactations. However, extreme depth of the udder cleft does not seem to be needed, as the effect of central ligament is non-existent from the middle of the scale onwards. But low scores for this trait are related to poor udder health and longevity. On the lower side of the scale, the relationship is like the one for Udder Depth and Front Teat Placement, showing that these traits describe in common the inability of the udder to last for multiple lactations.
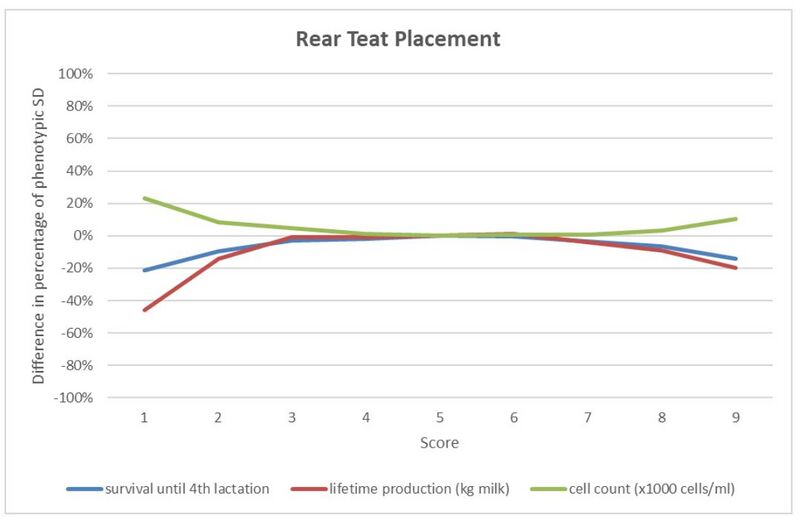
Rear teat placement
The graph shows that Rear Teat Placement is a trait for which extremes should be avoided. Wide Rear Teat Placement (low score) is often related to a weak Central Ligament. This relationship could explain the lower survival and the high cell count associated with low scores for Rear Teat placement. It should be mentioned, regarding this trait, that an important part of the data comes from farms without robotic milking. Even though, rear teats which are placed close together are linked with a slightly lower survival.
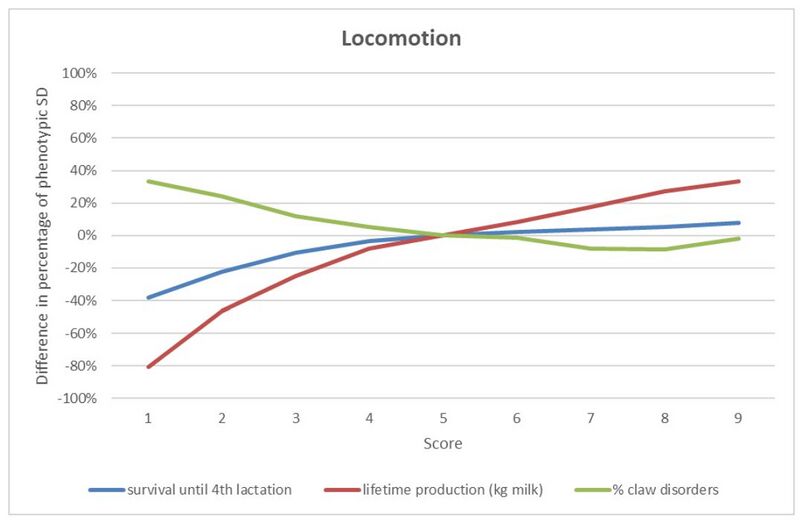
Locomotion
The relation of locomotion with survival and lifetime production is strong. Lifetime production is much more reduced than survival in cows with a low score for locomotion. The cause of the association with claw disorder might be claw diseases leading to a bad locomotion as well as locomotion leading to claw diseases.
Body Condition Score (BCS)
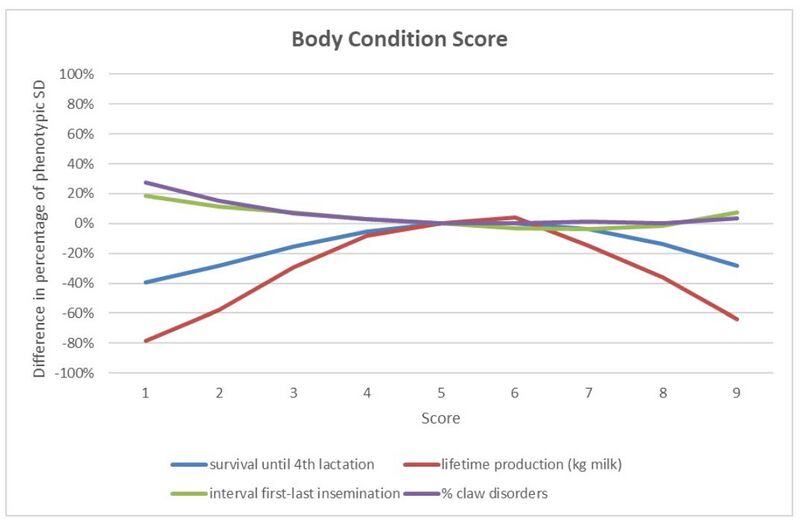
For Body Condition Score, the most important association can be found with longevity traits, both survival and lifetime production. For both traits there is an intermediate optimum. Cows with extreme low score for BCS appears to have more claw disorders and higher interval between first and last insemination.
Bone structure
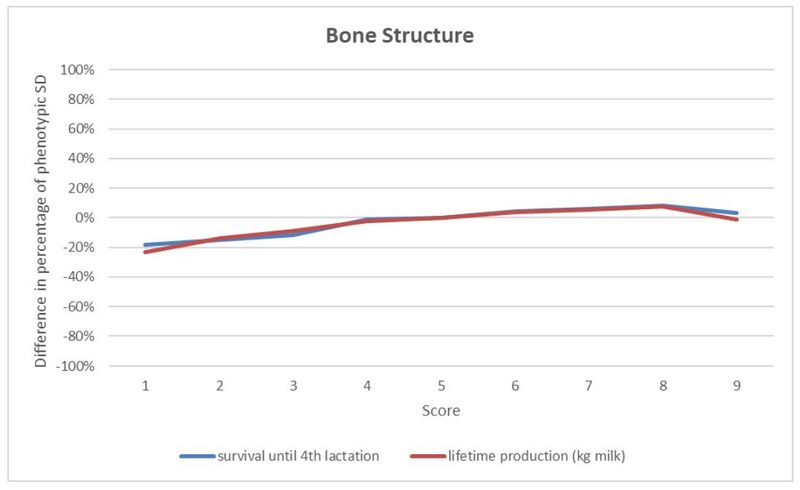
The thickness of the bone has a weak relation with survival and lifetime production. Low values - meaning a coarse bone structure - are related to a lower survival.
Rear udder width
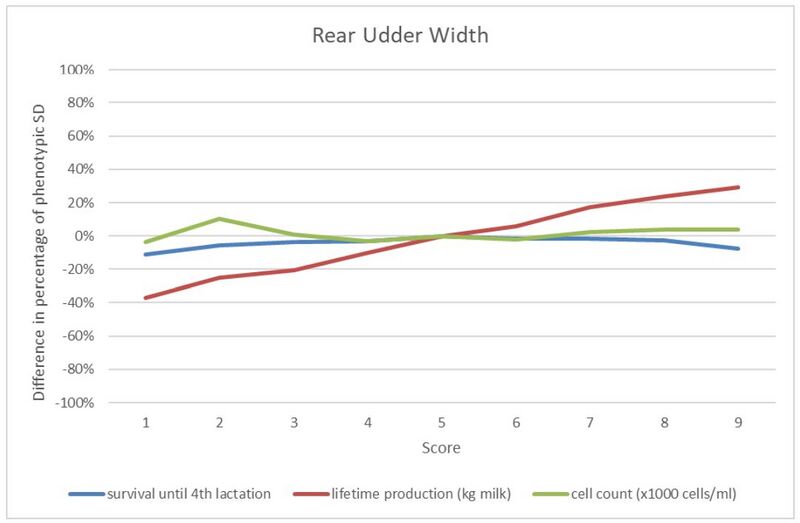
Rear Udder Width has a positive and nearly linear relationship with lifetime production. This relationship is like the one found with Rear Udder Height. The reason is that more room is available for milk production, without deepening the udder.
Muscularity
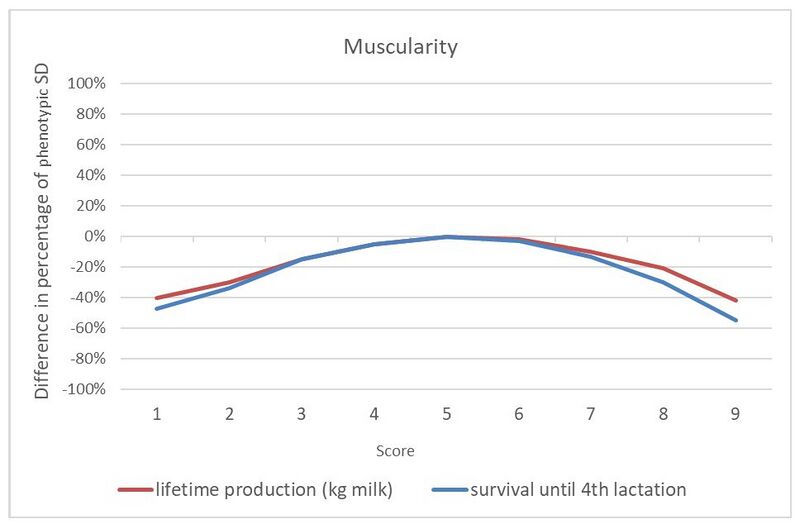
Muscularity, a standard trait for dual purpose cattle, shows an intermediate optimum for survival and lifetime production. The use of Muscularity in linear description is also an indicator of functional traits. As with milk production, its optimum should be defined in relation to the breeding goal for meat production on one hand, and survival on the other hand.
Fore udder length
Fore Udder Length, a second trait that is specific for dual purpose cattle, has an intermediate optimum for survival, and for lifetime production. Shorter fore udders are found in cows with low production. Very long fore udders usually produce more milk, what leads to a higher lifetime production.
